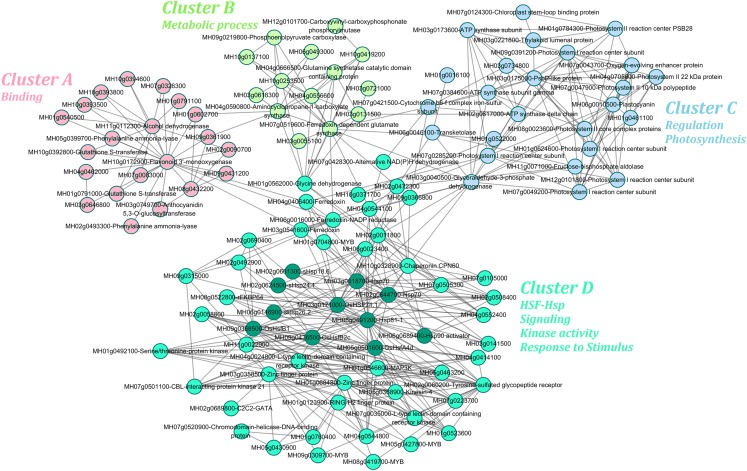
Figure 6. Co-regulatory network predicted from the differential gene and protein data of II8 flag leaves during long-term heat stress.
The protein–protein interaction networks were identified using the STRING database. It contained four subclusters; namely, cluster A, cluster B, cluster C, and cluster D. Members of the HSF–Hsp network were dark green nodes in cluster D.

