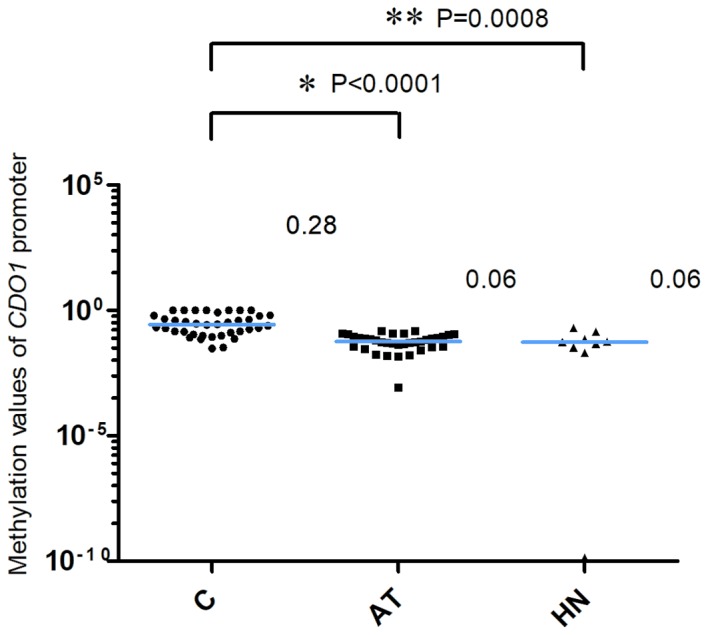
Figure 1.

Methylation of the CDO1 promoter. The 2−ΔCq values of the CDO1 promoter in the AT and HN groups were significantly lower compared with those in the C group. *P<0.0001 and **P=0.0008, AT and HN groups vs. C group, respectively. The blue horizontal lines represent median values. One single data point in the HN group was outside the axis limits. C, cancer tissues; AT, adjacent tissues; HN, the healthy non-adjacent tissue from patients with extra-hepatic biliary tract cancer; CDO1, cysteine dioxygenase 1.
