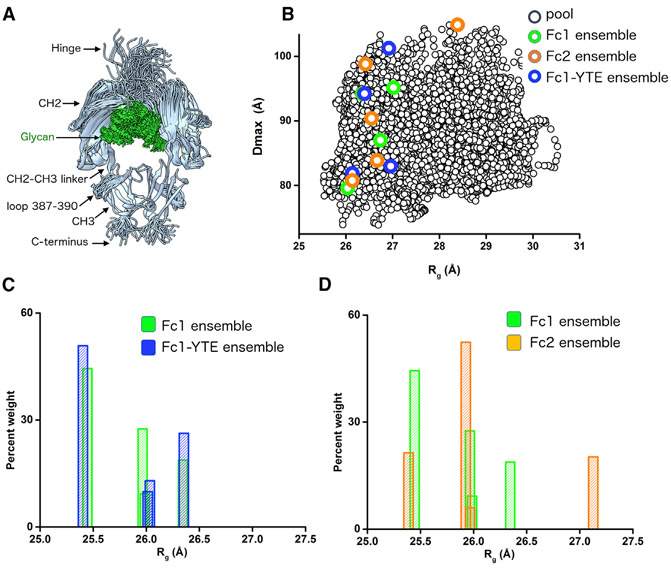
Figure 2. Conformational Sampling and Percent Weighted Distribution of Rg of Fc Isotypes.
(A) Representative 100 conformers of Fc1 derived by BILBOMD sampling.
(B) Maximal dimension (Dmax) values of the 3,000 conformers in the entire pool (black) with respect to Rg. Rg and Dmax values of selected conformers in the ensemble matching SAXS profiles for Fc1 (green), Fc2 (orange), and Fc1-YTE, (blue) are indicated.
(C and D) Comparison of Fc1 (green) and Fc1-YTE (blue), or Fc2 (orange) weighted distribution of four models from the selected ensemble with respect to the Rg values of the model.

