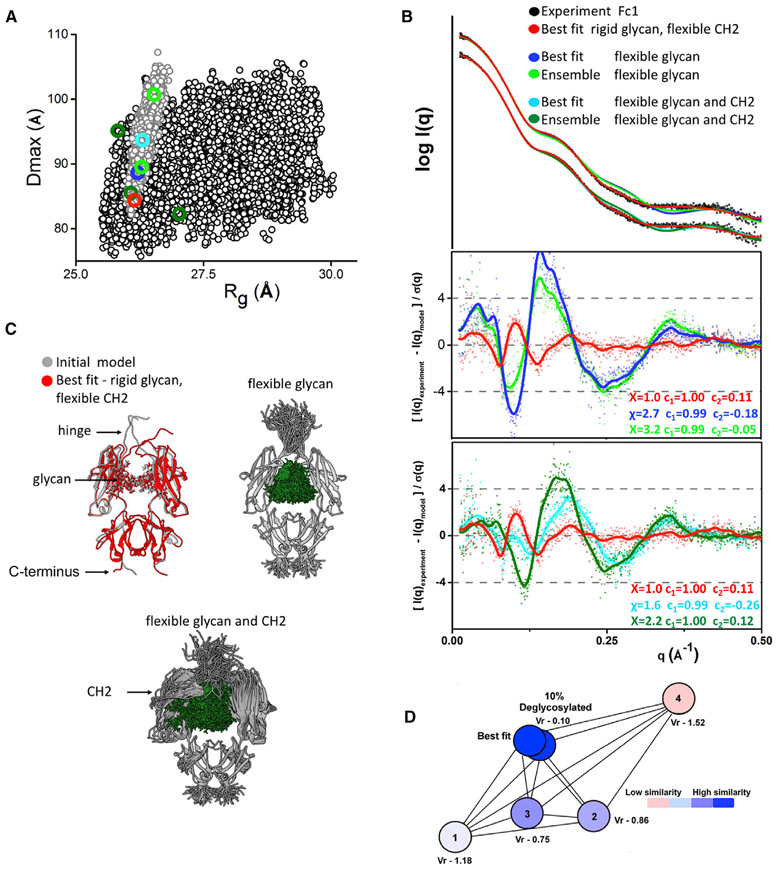
Figure 4. Evaluating the Origin of Flexibility in Fcs.
(A) Dmax and Rg values for the 3,000 conformers derived by the sampling of flexible glycan chain and hinge region (gray dot) in comparison with the 6,000 conformers derived by the sampling of flexible CH2-CH3 linker, glycan, and hinge region (black). Rg and Dmax values of selected best-fit and multistate ensemble models are indicated and colored as in (B).
(B) Poor fits and the ratios of the experimental (black dots) and theoretical SAXS profiles for the best-fit (blue and cyan), and multistate ensemble models (green and dark green), selected from two samplings with flexible glycan chains. Fit for the best-fit model selected from sampling with rigid glycan chains is shown for the comparison (red).
(C) Comparison of initial (gray) and best-fit model (red) selected from sampling with rigid glycan chains. The type of the flexibility that was explored in the sampling of flexible glycan chains or combined glycan and CH2-CH3 flexibility is shown by the representative models.
(D) The force plot of the Vr values for the SAXS profiles mimicking 100% and 90% of glycosylation in the comparison with the conformers from the Fc1 multistate ensemble model (models 1, 2, 3, and 4) indicates how similar or not are the theoretical SAXS profiles. Vr values were assigned a gradient color with blue (high similarity) and red (low similarity).

