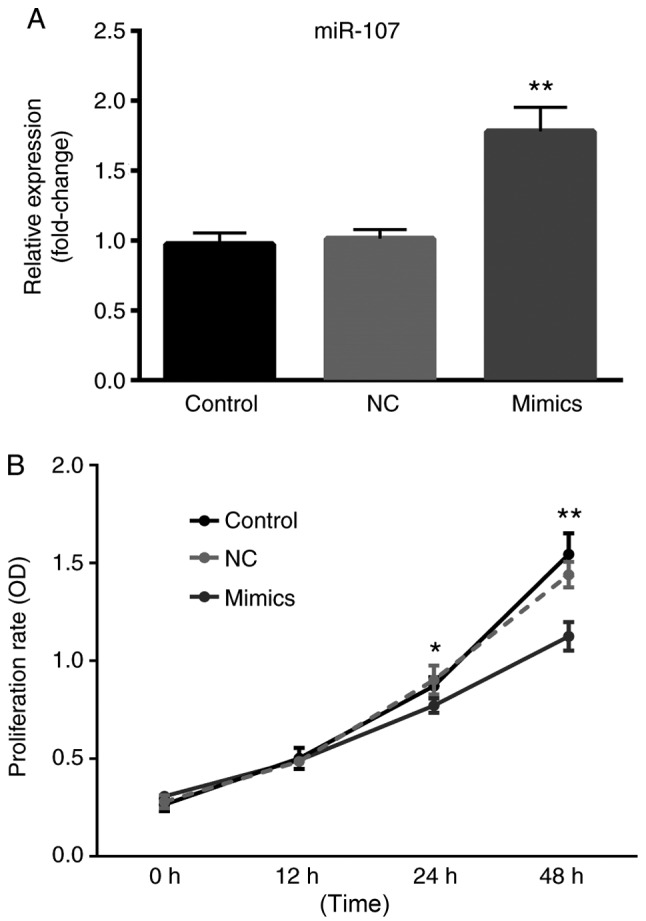
Figure 4.

Effect of miR-107 overexpression on the proliferation of A549 cells. (A) Transfection efficiency of miR-107 determined using reverse transcription-quantitative polymerase chain reaction analysis in different groups (n=3). **P<0.01 vs. control untransfected cells and NC groups. (B) Effect of miR-107 overexpression on the proliferation of A549 cells (n=3). *P<0.05, mimics vs. NC at 24 h; **P<0.01, mimics vs. NC at 48 h. miR, microRNA; NC, negative control; OD, optical density.
