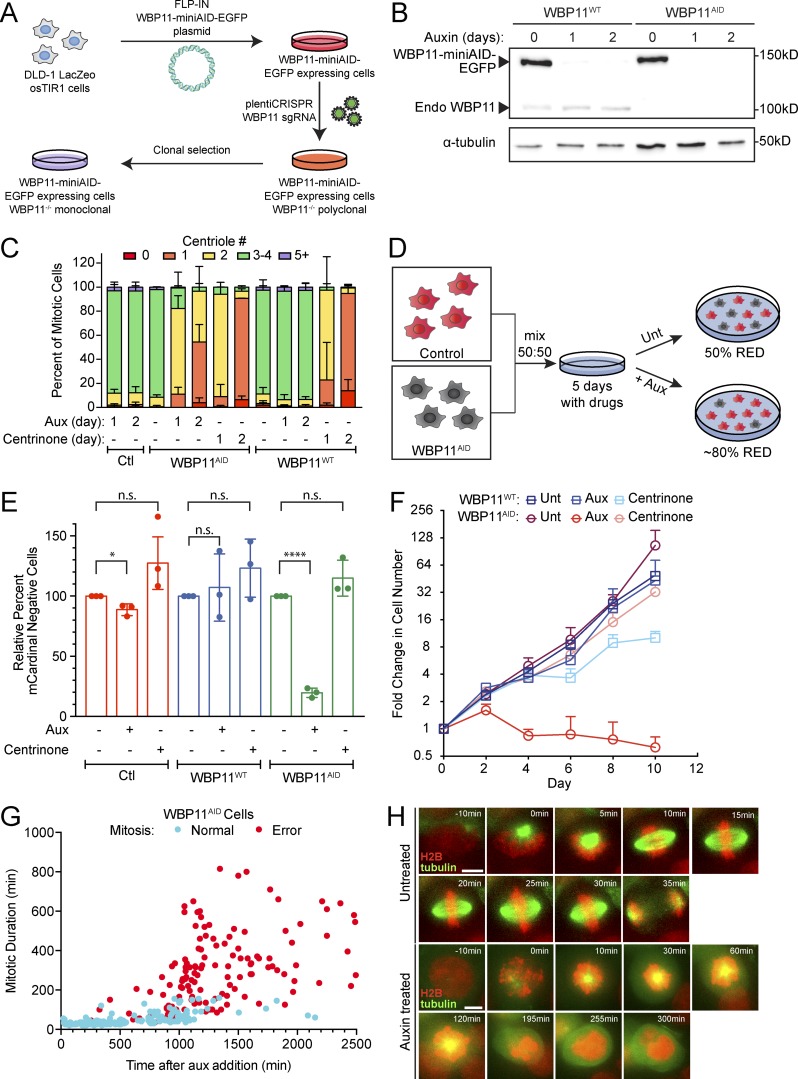
Figure 2.
WBP11 is required for cell proliferation and timely progression through mitosis. (A) Schematic of WBP11AID cell line design. A WBP11-mAID-EGFP transgene was mutated to be resistant to Cas9 cleavage and integrated into DLD-1 cells at a predefined genetic locus. Cells were then transduced with a lentivirus encoding Cas9 and an sgRNA targeting endogenous WBP11. Monoclonal cell lines were screened for loss of endogenous WBP11. (B) Immunoblot showing expression of the WBP11-mAID-EGFP transgene and its degradation after auxin addition. WBP11WT cells express endogenous WBP11 and the WBP11-mAID-EGFP transgene, while WBP11AID cells express only the WBP11-mAID-EGFP transgene. (C) Quantification of centriole number in mitotic cells 24 or 48 h after degradation of WBP11 with auxin addition or inhibition of PLK4 with centrinone. n = 3, ≥49 cells per experiment. Error bars represent SD. (D) Schematic of a competition growth assay. mCardinal-expressing cells were mixed in a 1:1 ratio with WBP11WT or WBP11AID cells and grown in auxin or centrinone for 5 d. Cells were then analyzed by flow cytometry for mCardinal expression and the ratio of mCardinal-positive to mCardinal-negative cells was determined by flow cytometry. Unt, untreated. (E) Quantification of relative growth of cells using the competition assay following 5 d of auxin treatment. Relative growth was determined by evaluating the fraction of mCardinal-positive cells in the treated compared with untreated populations. n = 3. Unpaired parametric t test. *, P = 0.0160; ****, P < 0.0001. Error bars represent SD. (F) Growth assay showing the fold increase in cell number after auxin or centrinone addition. Data are means ± SEM, n = 3, performed in triplicate. Error bars represent SEM. (G) Quantification of mitotic duration from time-lapse videos of WBP11AID cells expressing H2B-iRFP. The x axis shows how long after addition of auxin WBP11AID cells entered into mitosis. Blue dots mark cells that completed mitosis normally and red dots mark cells that underwent mitotic errors. n = 3, ≥77 cells per experiment. (H) Representative frames from videos of WBP11AID cells stably expressing H2B-iRFP (red) and RFP-tubulin (green). Cells were either untreated or treated with auxin to induce WBP11AID destruction. Scale bars represent 15 µm.

