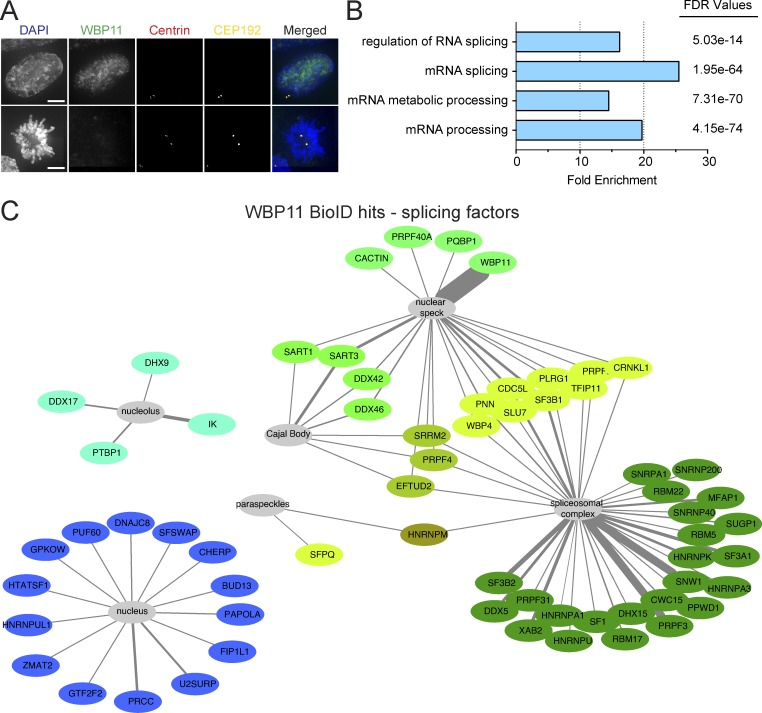
Figure 3.
The proximity interactome of WBP11 contains many splicing factors. (A) Representative image showing WBP11-mAID-EGFP localization in interphase (top panels) and mitosis (bottom panels). Scale bars represent 10 µm. (B) A subset of the top enriched GO terms upon analysis of the WBP11 proximity interactome. PANTHER GO biological process complete analysis was used to calculate the fold enrichments and FDR values. (C) Schematic of known splicing proteins that were present in the WBP11-BirA proximity interactome plotted using Cytoscape. Only high-confidence hits are shown. Proteins with similar interaction profiles are colored the same. Line thickness represents the ratio calculated from the enrichment of WBP11-BirA versus BirA alone. n = 4. Raw data are shown in Table S2.

