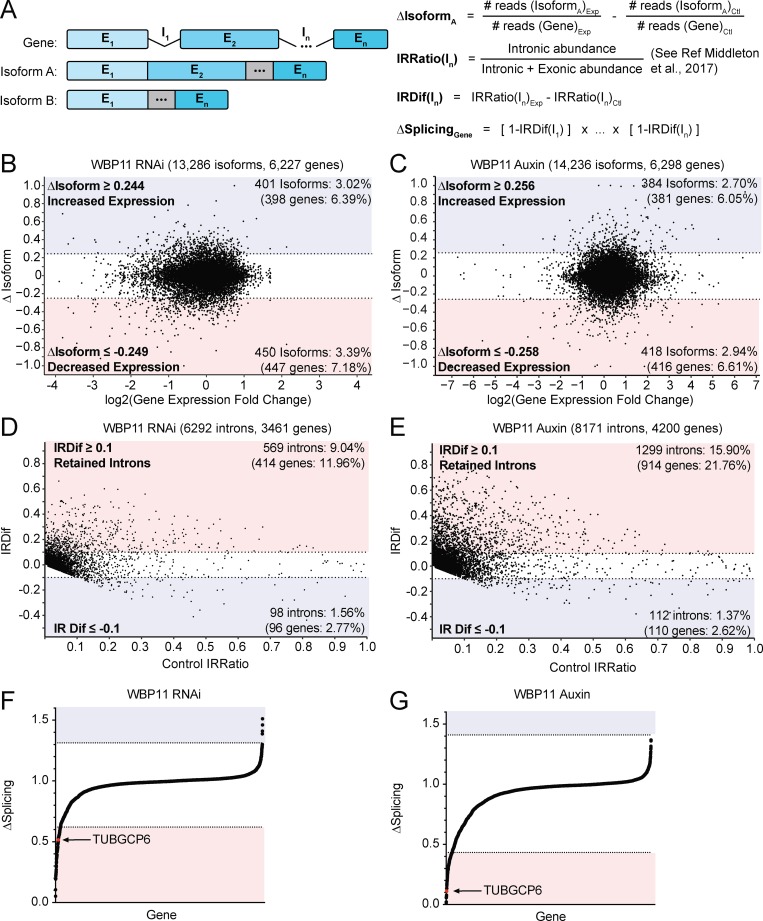
Figure 4.
WBP11 is required for proper splicing of a subset of introns. (A) Schematic describing the RNA-seq analysis performed. For a given gene, the change in isoform expression (ΔIsoform) was calculated by subtracting the fraction of reads for a gene that map back to an isoform in the control sample from the corresponding value in the experimental sample. IRratio was calculated using the IRFinder program and measures the frequency with which an intron is retained in an mRNA as a value from 0 to 1 (Middleton et al., 2017). IRDif was calculated by subtracting the IRratio of each intron in the control from the experimental condition. ΔSplicing was calculated by taking the IRDif for each intron and subtracting it from 1 to determine the fraction of mRNAs that are correctly spliced for that intron. We then multiplied this value for each intron in an mRNA to determine the percentage of the mRNAs for each gene that are correctly spliced. (B) Classification of isoforms that were differentially expressed 72 h after WBP11 depletion by RNAi. The ΔIsoform value for each isoform was plotted against fold change in gene expression. Isoforms with a more than two SD change in expression were considered as hits. Colors indicate isoforms with increased (blue) or decreased (red) expression following WBP11 depletion. Raw data are shown in Tables S3 and S4. (C) Classification of isoforms that were differentially expressed 48 h after WBP11 degradation by addition of auxin. The ΔIsoform value for each isoform was plotted against fold change in gene expression. Isoforms with a more than two SD change in expression were considered hits. Colors indicate isoforms with increased (blue) or decreased (red) expression following WBP11 depletion. Raw data are shown in Tables S3 and S4. (D) Classification of introns detected by mRNA-seq 72 h after WBP11 depletion by RNAi. The IRDif score of each intron was plotted against the IRratio of that same intron in the control sample. Colors indicate introns that are excised more efficiently (blue), or retained more often (red), following WBP11 depletion. Raw data are shown in Table S5. (E) Classification of introns detected by mRNA-seq 48 h after WBP11 degradation by addition of auxin. The IRDif score of each intron was plotted against the IRratio of that same intron in the control sample. Colors indicate introns that are excised more efficiently (blue), or retained more often (red), following WBP11 depletion. Raw data are shown in Table S5. (F) Plot showing the change in the fraction of completely spliced mRNA for each gene 72 h after WBP11 depletion by RNAi. Colors indicate three SDs above (blue) or below (red) the average level of mRNA splicing observed. Raw data are shown in Table S6. (G) Plot showing the change in the fraction of completely spliced mRNA for each gene 48 h after WBP11 degradation with auxin. Colors indicate three SDs above (blue) or below (red) the average level of mRNA splicing observed. Raw data are shown in Table S6.

