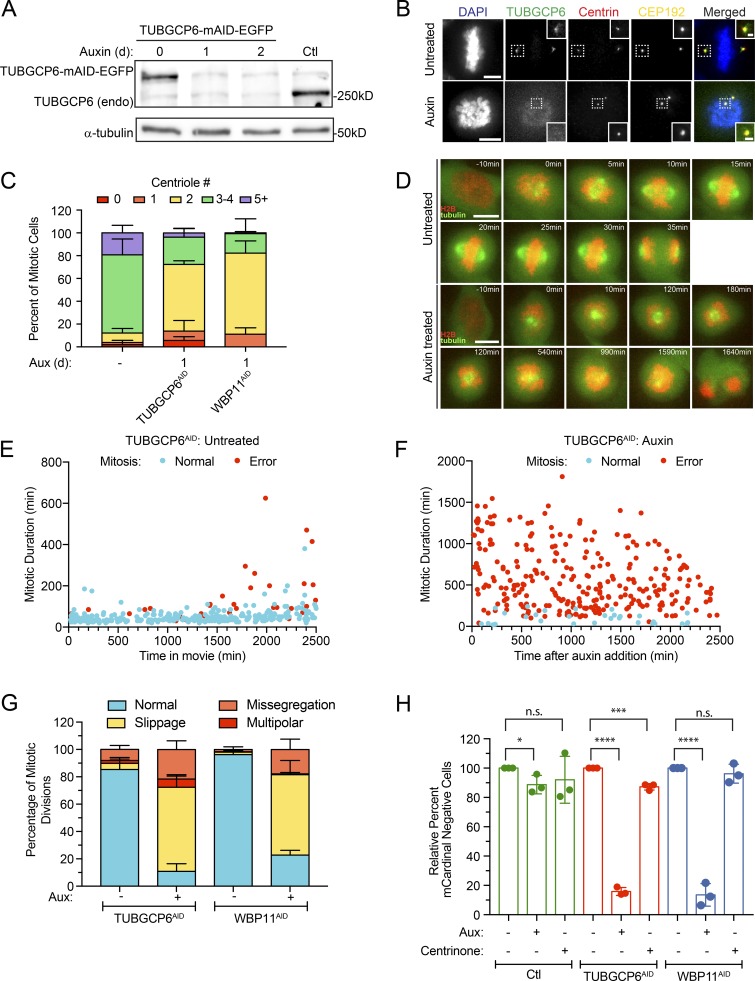
Figure 7.
TUBGCP6 depletion produces phenotypes similar to WBP11 loss. (A) Immunoblot showing expression of endogenously tagged TUBGCP6-mAID-EGFP and its degradation after auxin addition. In TUBGCP6AID cells, both endogenous TUBGCP6 alleles were tagged with mAID-EGFP. TUBGCP6WT cells are shown as a control. (B) Representative images of endogenously tagged TUBGCP6-mAID-EGFP. Cells were either untreated or treated with auxin to induce TUBGCP6AID destruction. Scale bars represent 5 µm; 1 µm in zoomed-in regions. (C) Quantification of centriole number in mitotic cells 24 h after TUBGCP6-mAID-EGFP degradation with auxin. Data are shown alongside the 24-h auxin degradation of WBP11AID from Fig. 2 C. n = 3, ≥50 cells per experiment. Error bars represent SD. (D) Representative frames from videos of TUBGCP6AID cells stably expressing H2B-iRFP (red) and EGFP-tubulin (green). Cells were either untreated or treated with auxin to induce TUBGCP6AID destruction. Scale bars represent 10 µm. (E) Quantification of mitotic duration from time-lapse videos of TUBGCP6AID cells expressing H2B-iRFP. The x axis shows the time in the video at which the untreated TUBGCP6AID cells entered into mitosis. Blue dots mark cells that completed mitosis normally and red dots mark cells that underwent mitotic errors. n = 3, ≥100 cells per experiment. (F) Quantification of mitotic duration from time-lapse videos of TUBGCP6AID cells expressing H2B-iRFP. The x axis shows the time after auxin addition that TUBGCP6AID cells entered into mitosis. Blue dots mark cells that completed mitosis normally and red dots mark cells that underwent mitotic errors. n = 3, ≥100 cells per experiment. (G) Quantification of the types of mitotic errors observed in cells depleted of TUBGCP6 or WBP11 for all mitotic divisions after 1,000 min of auxin treatment (images and mitotic time for WBP11 cells shown in Fig. 2). Error bars represent SD. (H) Quantification of relative growth of cells using the competition assay following 5 d of auxin treatment. Relative growth was determined by evaluating the fraction of mCardinal-positive cells in the treated compared with untreated populations. n = 3. Unpaired parametric t test. *, P = 0.0366; ***, P = 0.0006; ****, P < 0.0001. Error bars represent SD.

