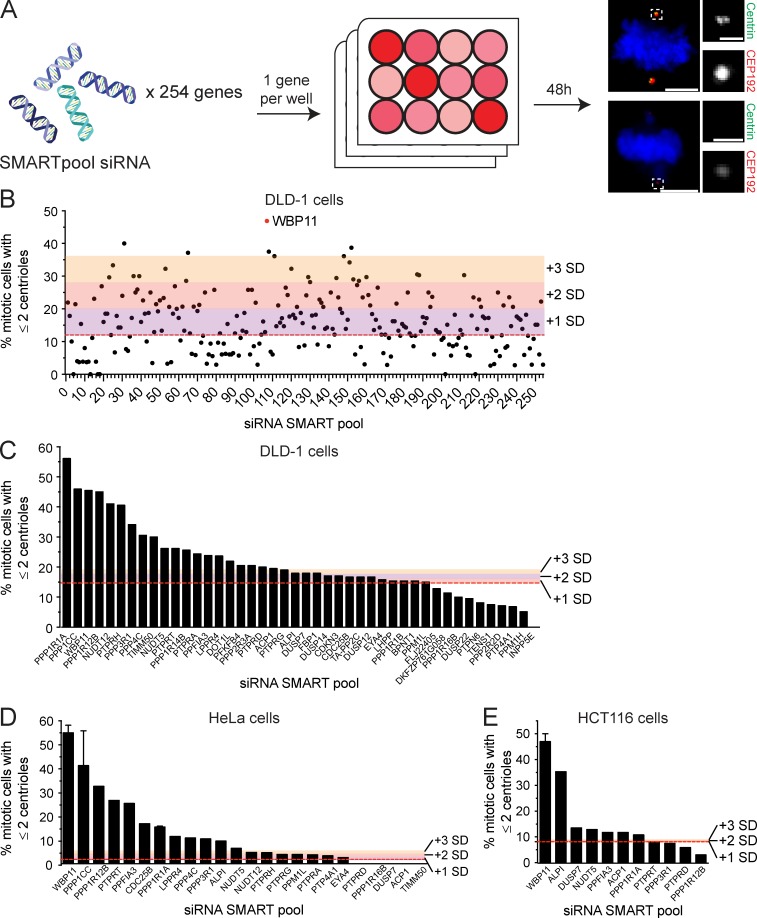
Figure S1.
siRNA screen to identify novel phosphatase or phosphatase-interacting proteins required for centriole biogenesis. (A) Schematic representation of the screen design. A SMARTpool of four siRNAs targeting each gene was transfected into DLD-1 cells. 48 h after siRNA transfection, centriole number was analyzed in mitotic cells. A total of 254 genes were screened. Scale bars represent 5 µm; 1 µm in inset. (B) Graph shows the fraction of cells with two or fewer centrioles in mitosis. Each point represents a single gene. Raw data are displayed in Table S1. Colors indicate one, two, or three SDs above the level of centriole underduplication observed in untransfected DLD-1 cells (red line). Hits were considered as genes that are more than two SDs above the control. More than 25 mitotic cells per siRNA were analyzed. (C) Secondary validation of the top hits from the initial screen in DLD-1 cells. Colors indicate one, two, or three SDs above the level of centriole underduplication observed in untransfected DLD-1 cells (red line). n = 1, ≥25 mitotic cells per siRNA were analyzed. (D) Validation of the top hits from the initial screen in HeLa cells. Colors indicate one, two, or three SDs above the level of centriole underduplication observed in untransfected DLD-1 cells (red line). n ≥ 1, ≥25 mitotic cells per siRNA were analyzed. Error bars represent SD. (E) Validation of the top hits from the initial screen in HCT116 cells. Colors indicate one, two, or three SDs above the level of centriole underduplication observed in untransfected DLD-1 cells (red line). n ≥ 1, ≥25 mitotic cells per siRNA were analyzed. Error bars represent SD.

