Figure S2.
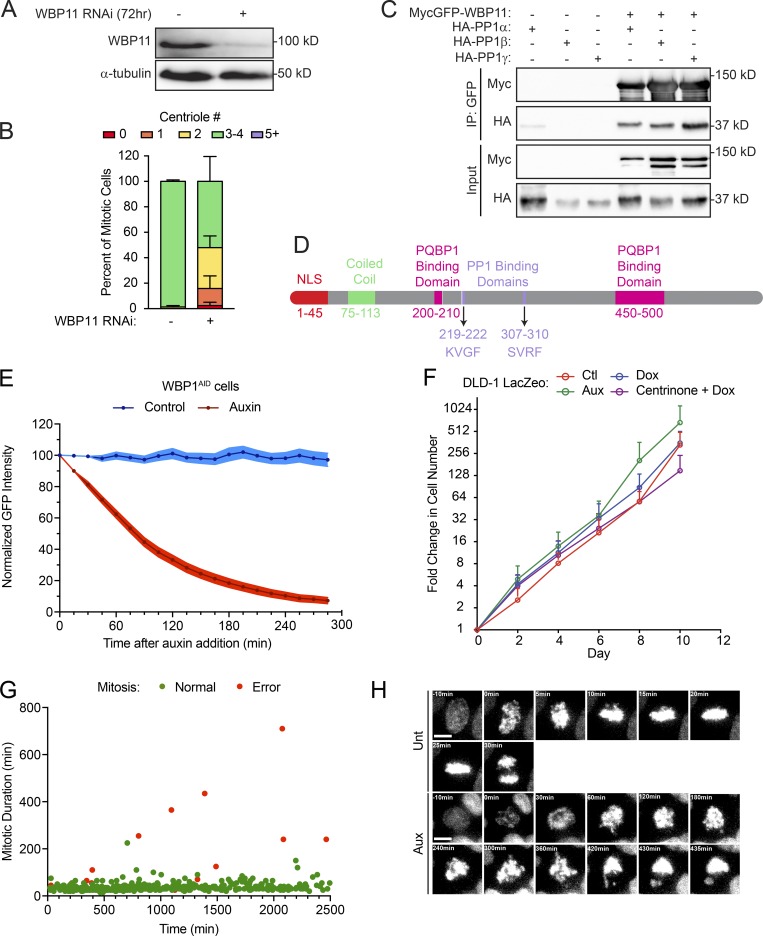
Cells lacking WBP11 show major growth defects. (A) Immunoblot showing expression levels of WBP11 72 h after siRNA transfection in RPE-1 cells. (B) Quantification of centriole number in mitotic RPE-1 cells 72 h after depletion of WBP11 with SMARTpool siRNA. n = 3, ≥50 cells per experiment. Error bars represent SD. (C) Immunoblot showing coimmunoprecipitation (IP) of HA-PP1α, β, and γ with MycGFP-WBP11. (D) Schematic of WBP11 showing its functional domains and the two PP1 binding sites. (E) Quantification of the intensity of the WBP11-mAID-EGFP transgene measured from time-lapse videos of WBP11AID cells after auxin addition. n = 3, 20 cells analyzed per point per replicate. Error bars represent SEM. (F) Growth assay showing the fold increase in cell number of DLD-1 LacZeo cells treated with tetracycline, auxin, or centrinone. Data are means ± SEM, n = 3 (untreated n = 2), performed in triplicate. (G) Quantification of mitotic duration from time-lapse videos of untreated WBP11AID cells expressing H2B-iRFP. The x axis shows how long after the beginning of filming WBP11AID cells entered into mitosis. Green dots mark cells that completed mitosis normally and red dots mark cells that underwent mitotic errors. n = 3, ≥100 cells per experiment. (H) Representative frames from videos of WBP11AID cells stably expressing H2B-iRFP. Cells were either untreated or treated with auxin to induce WBP11AID destruction. Scale bars represent 10 µm.

