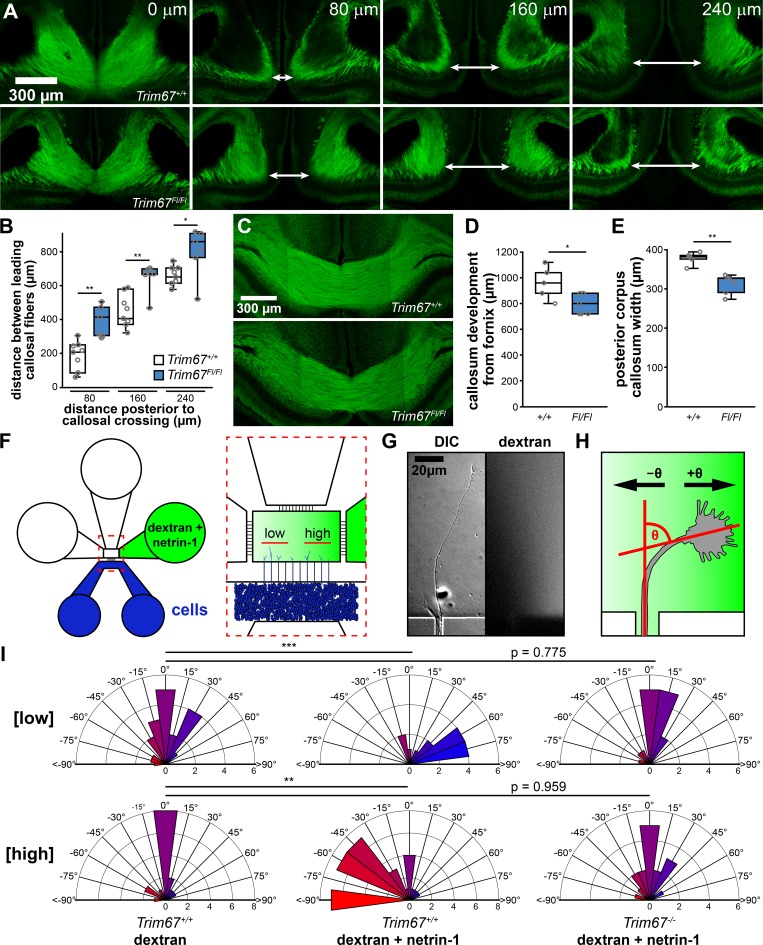
Figure 1.
Trim67 is required for axonal development and guidance in vivo and in vitro. (A) Confocal micrographs of serial coronal sections of GFP in the corpus callosum of murine brains fixed at P0 from Trim67+/+:Nex-Cre:Tau-Lox-STOP-Lox-GFP and Trim67Fl/Fl:Nex-Cre:Tau-Lox-STOP-Lox-GFP littermates. Arrows demarcate leading fibers of the corpus callosum in sections 80, 160, and 240 µm posterior to the final connection of the callosum. (B) Individual data points and box plots of the distance between leading fibers of the corpus callosum at P0. n (animals) = 8 Trim67+/+:Nex-Cre:Tau-Lox-STOP-Lox-GFP, 6 Trim67Fl/Fl:Nex-Cre:Tau-Lox-STOP-Lox-GFP. (C) Confocal micrographs of coronal sections of the corpus callosum at P4, 160 µm anterior to the final connection of the callosum. (D and E) Quantification of the extent of callosal development expressed as individual data points and box plots of the distance from the fornix to the separation of the callosal leading fibers (D) and callosal width at the midline eight sections posterior to the fornix at P4 (E). n (animals) = 5 +/+, 6 Fl/Fl. (F) Schematic of microfluidic axon guidance chambers. (G) Example axon extending from a microgroove into the axon guidance chamber, and fluorescent dextran used to visualize the gradient. (H) Diagram depicting axon turning angle measured between a line bisecting the axonal growth cone and a line overlapping and parallel to the axon as it exits microgroove. (I) Rose plots of embryonic cortical neuron axon turning angles in a gradient of fluorescent dextran or dextran + netrin-1. Low concentration denotes the four microgrooves furthest from the gradient source, while the four microgrooves closest to the source are denoted high concentration (Taylor et al., 2015). Positive turning angles represent axon turning toward the netrin-1 source; negative angles represent axon turning away from the source. Three experiments per genotype/treatment condition. n (axons) = 20 +/+ low [dextran], 17 +/+ high [dextran], 23 +/+ low [netrin], 43 +/+ high [netrin], 15 −/− low [netrin], 17 −/− high [netrin]. *, P < 0.05; **, P < 0.01. Box plots are minimum, Q1, Q2, Q3, maximum.

