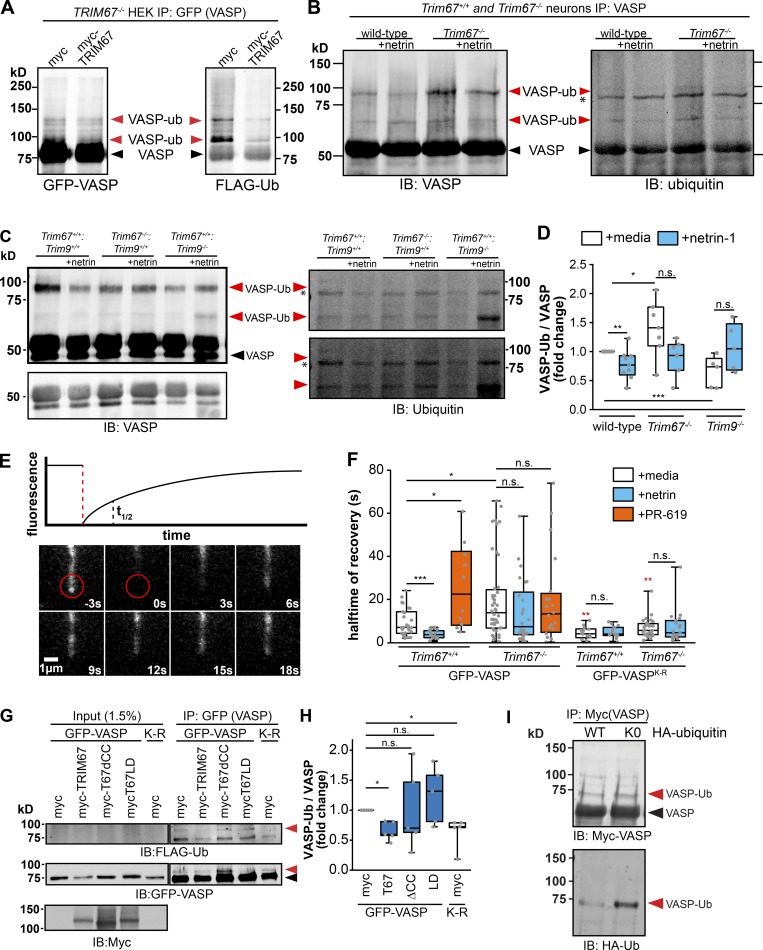
Figure 6.
TRIM67 inhibits the ubiquitination and dynamics of the actin polymerase VASP. (A) Western blot of GFP-VASP immunoprecipitated from denatured TRIM67−/− HEK293 cells expressing myc or MycTRIM67, showing GFP+ bands that comigrate and colabel with ubiquitin (VASP-Ub, red arrowheads), which are heavier than unmodified GFP-VASP (black arrowheads). (B and C) Western blot of VASP immunoprecipitated from denatured cultured embryonic cortical lysate, showing bands that comigrate and colabel with ubiquitin (VASP-Ub, red arrowheads), which migrate at an apparent heavier molecular weight than unmodified VASP (black arrowhead). Asterisk (*) by ubiquitin immunoblot (IB) marks a nonspecific ubiquitin band in all lanes. We note that the endogenous ubiquitinated species are more difficult to detect than ubiquitination of overexpressed and tagged proteins, potentially due to lower protein expression and antibody quality. As recognized in the field, endogenous ubiquitination of proteins is notoriously difficult to detect, particularly when the substrate is not modified by multiple ubiquitins (poly-ubiquitinated). Further, acquiring sufficient material from timed pregnant litters of multiple genotypes is limiting. We thus provide two examples of endogenous ubiquitination assays and multiple intensity exposures to better highlight the bands of interest. (D) Individual data points and box plots of VASP-Ub relative to total VASP levels, normalized to untreated WT of each experiment. Bars are averages of five to seven experiments. n (cultures) = 9 +/+, 5 Trim9−/−, 7 Trim67−/−. (E) Diagram of a fluorescence recovery curve following photobleaching of GFP-VASP at the tip of a filopodium with a representation of the halftime of recovery (t1/2), alongside an image montage of the FRAP of GFP-VASP in a transfected embryonic cortical neuron. (F) Quantification of the FRAP t1/2 of GFP-VASP or GFP-VASPK-R in embryonic cortical neurons treated with netrin-1 or the deubiquitinase inhibitor PR-619. Statistical comparisons in red are with respect to the GFP-VASP FRAP t1/2 in untreated cells of the same genotype. Three to five experiments per genotype/treatment. n (cells) = GFP-VASP: 27 +/+ media, 16 +/+ netrin, 10 +/+ PR-619, 28 −/− media, 26 −/− netrin, 20 −/− PR-619; GFP-VASP(K-R): 14 +/+ media, 15 +/+ netrin, 28 −/− media, 19 −/− netrin. (G) Ubiquitination-precipitation assays of GFP-VASP expressed in HEK293T cells lacking TRIM67 expressing indicated myc-TRIM67 constructs, along with FLAG-ubiquitin. A VASP band that comigrates with FLAG-Ub (red arrowhead) appears heavier than unmodified VASP (black arrowhead). (H) Individual data points and box plots of VASP-Ub (FLAG signal relative to total GFP-VASP) normalized to the myc control condition. n (cultures) = 5 for all conditions. (I) Western blot of Myc-VASP immunoprecipitated from denatured HEK293 cells expressing HA-ubiquitin (WT) or HA-ubiquitin knockout (K0), showing a single predominant Myc+ species that comigrates and colabels with HA-ubiquitin (VASP-Ub, red arrowheads), which is heavier than unmodified Myc-VASP (black arrowhead). *, P < 0.05; **, P < 0.01; ***, P < 0.005; n.s., P > 0.05. Box plots are minimum, Q1, Q2, Q3, maximum.

