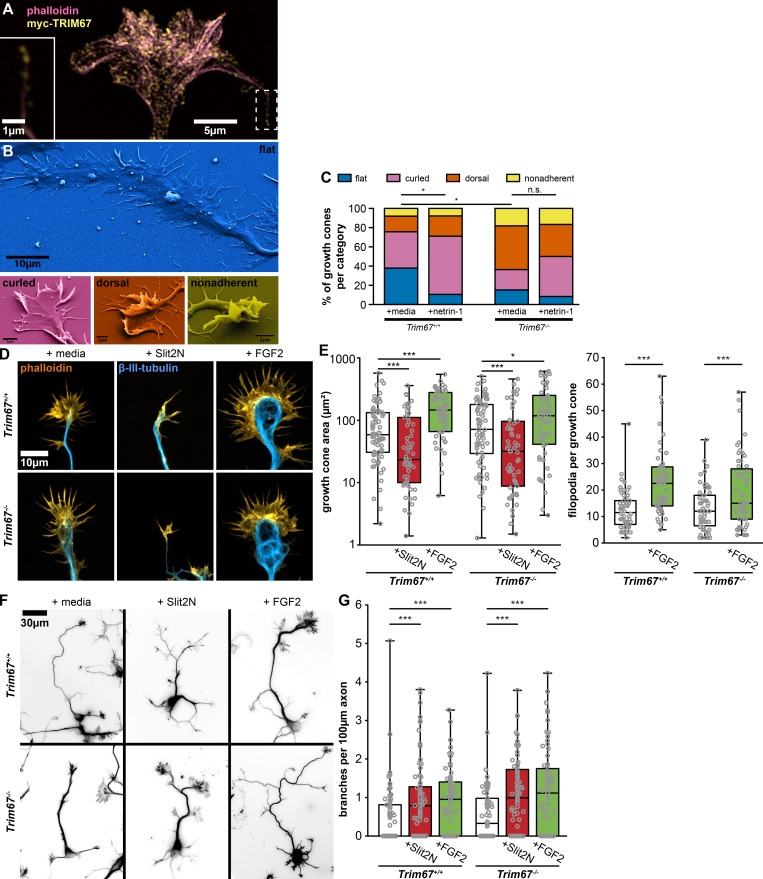
Figure S1.
TRIM67 growth cone response to morphogens. (A) SIM image of myc-TRIM67 and filamentous actin in an axonal growth cone. TRIM67 localizes to the tip of a filopodium (inset, same area as dashed box). (B) Examples of growth cone morphological categories as identified by scanning electron microscopy. (C) Quantification of growth cone morphology distributions of Trim67+/+ and Trim67−/− cortical neurons treated with media or netrin-1. Distributions are compared by Fisher’s exact test. n (cultures) = 3. n (cells) = 37 +/+ media, 38 +/+ netrin, 33 −/− media, 36 −/− netrin. (D) Examples of cortical embryonic axonal growth cones treated with media, Slit2N, or FGF2. (E) Individual data points and box-and-whisker plots showing the data spread in the interquartile range (box) and minimum and maximum (whiskers) of growth cone area and filopodia per growth cone following 40 min of treatment with the indicated guidance cues. n (cultures) = 3. n (cells) = 76 +/+ media, 56 +/+ Slit2N, 56 +/+ FGF2, 76 −/− media, 57 −/− Slit2N, 57 −/− FGF2. (F) Inverted images of neurons combining staining of both filamentous actin (phalloidin) and β-III-tubulin, treated for 24 h with media, Slit2N, or FGF2. (G) Individual data points and box-and-whisker plots showing the data spread in the interquartile range (box) and minimum and maximum (whiskers) of axon branching in response to the indicated guidance cues. n (cultures) = 3. n (cells) = 78 +/+ media, 79 +/+ Slit2N, 71 +/+ FGF2, 73 −/− media, 76 −/− Slit2N, 76 −/− FGF2. *, P < 0.05; ***, P < 0.005; n.s., not significant. Box plots are minimum, Q1, Q2, Q3, maximum.

