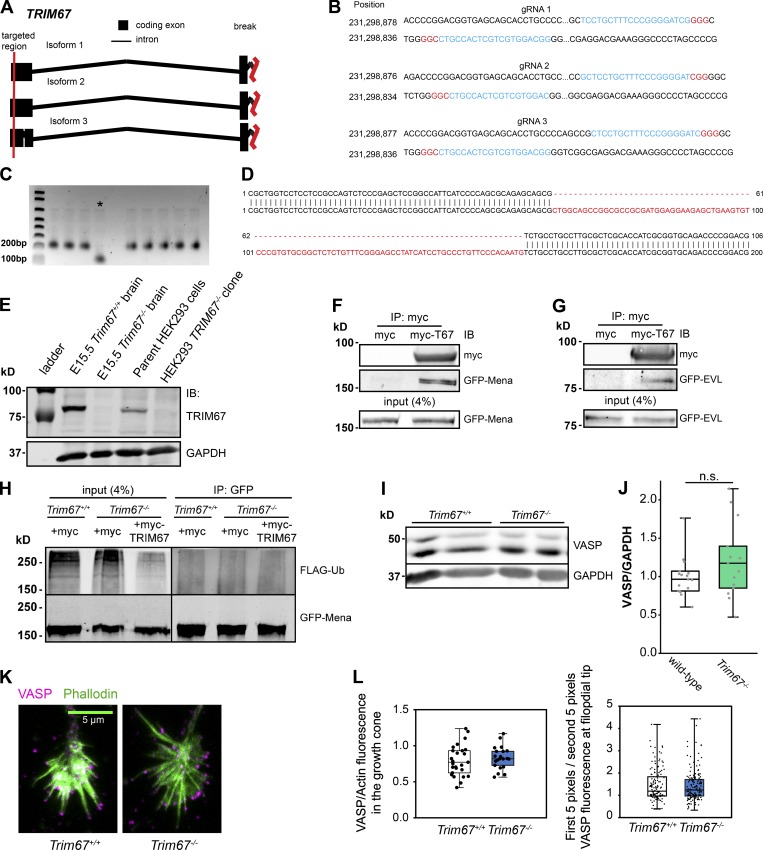
Figure S4.
TRIM67 interacts with all members of the Ena/VASP family and does not regulate VASP protein levels. (A–E) Generation of TRIM67−/− HEK293 cell lines. (A) CRISPR gRNA were designed to target the first exon in all known isoforms of TRIM67. Red vertical lines indicate the regions targeted by the gRNAs. (B) A set of three designed gRNAs (blue) targeting exon 1 of TRIM67. Two complementary gRNAs per set were used with nickase-Cas9 to reduce off target effect potential. The NGG sequence is highlighted in red. (C) PCR of genomic DNA from WT cells (lane 1) and multiple clones indicates a deletion of ∼100 bp in CRISPR clone 3, which is denoted by the asterisk. (D) Sequencing of HEK293 CRISPR clone 3 (top strand) shows a deletion of 94 base pairs in exon 1 of TRIM67. (E) Immunoblot (IB) for TRIM67 and GAPDH in E15.5 murine brain lysate, Trim67−/− murine brain lysate, HEK293 lysates, and CRISPR-Cas9 clone 3 TRIM67−/− HEK293 lysates. (F) Coimmunoprecipitation assay from TRIM67−/− HEK293T cells transfected with GFP-Mena and myc or myc-TRIM67. (G) Similar coimmunoprecipitation with GFP-EVL. (H) Immunoprecipitation of GFP-tagged Mena from denatured TRIM67−/− HEK293T cell lysate coexpressing FLAG-Ub and indicated myc or myc-TRIM67 reveals no heavy molecular weight Mena+ bands or change in ubiquitin levels among conditions. (I) Representative Western blot of VASP in embryonic cortical lysate from two animals of each indicated genotype. (J) Individual data points and box-and-whisker plots showing the data spread in the interquartile range (box) and min and max (whiskers) of VASP protein levels measured by Western blotting of embryonic cortical lysates, normalized to GAPDH. n (embryos) = 16 +/+, 14 −/−. (K) Maximum-projection immunofluorescence images demonstrating VASP abundance and localization in Trim67+/+ and Trim67−/− cortical neurons cultured 2 d in vitro. (L) Individual data points and box-and-whisker plots showing the data spread in the interquartile range (box) and minimum and maximum (whiskers) of total VASP fluorescence from three individual experiments, normalized to phalloidin fluorescence in the growth cone (left; n [cells] = 27 +/+, 21 −/−) and VASP localization to the filopodial tip (right; n [filopodia] = 140 +/+, 169 −/−). Box plots are minimum, Q1, Q2, Q3, maximum.

