Figure 2.
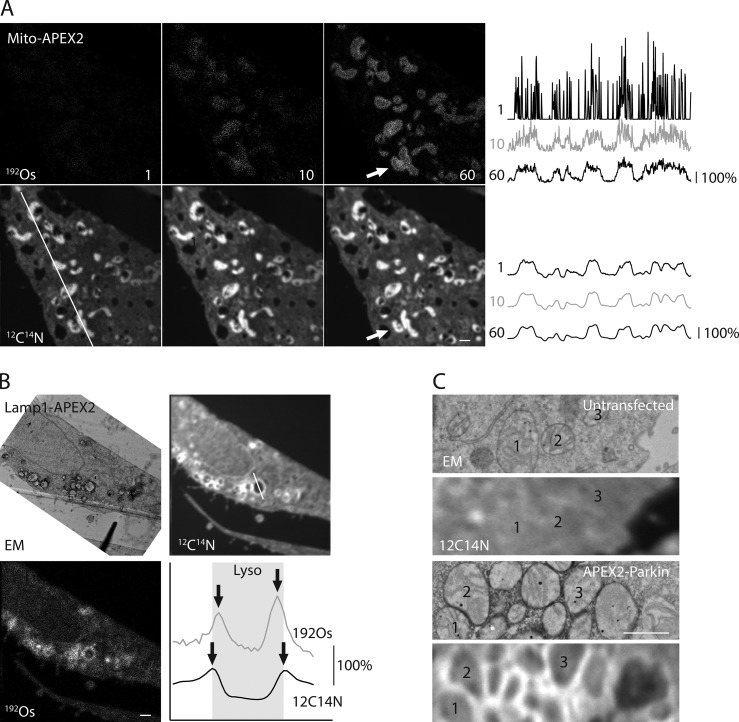
APEX2 is detected on single organelles by local enhancement of 12C14N. (A) 192Os (top, left) and 12C14N (bottom, left) MIMS images of HeLa cells expressing Mito-APEX2. 1, 10, or 60 consecutive images were summed, and their intensity was auto scaled. Rightmost panels are reproduced from Fig. 1 B. Arrow indicates a cluster of mitochondria with clear boundaries in the 12C14N image but not the 192Os image. Line scans of the region depicted in the leftmost image are shown for 192Os (top, right) and 12C14N (bottom, right). Intensity is relative to the average intensity within each scanned region. Image is representative of 11 Mito-APEX2 transfected HeLa cells (in three technical/two biological replicates). (B) EM, 12C14N, and 192Os MIMS images of HeLa cells expressing Lamp1-Apex2. Left panels are reproduced from Fig. 1 B. Line scan through a single lysosome is shown in the lower right. Arrows depict maximal local intensity of 192Os and 12C14N, indicating Lamp1-positive membranes of lysosomes, and shaded region depicts the limits of the lysosome. Image is representative of six Lamp1-APEX2 HeLa cells (in two technical replicates/one biological replicate). (C) HeLa cells untransfected (top) or transfected with APEX2-Parkin (bottom) and treated with carbonyl cyanide m-chlorophenyl hydrazone (CCCP) to induce translocation of Parkin to the outer mitochondrial membrane. Individual mitochondria are identified in the correlated EM (top) and MIMS (bottom) images. Image is representative of two APEX2-Parkin transfected HeLa cells (in one technical/biological replicate). Scale bar in all images = 1 µm.

