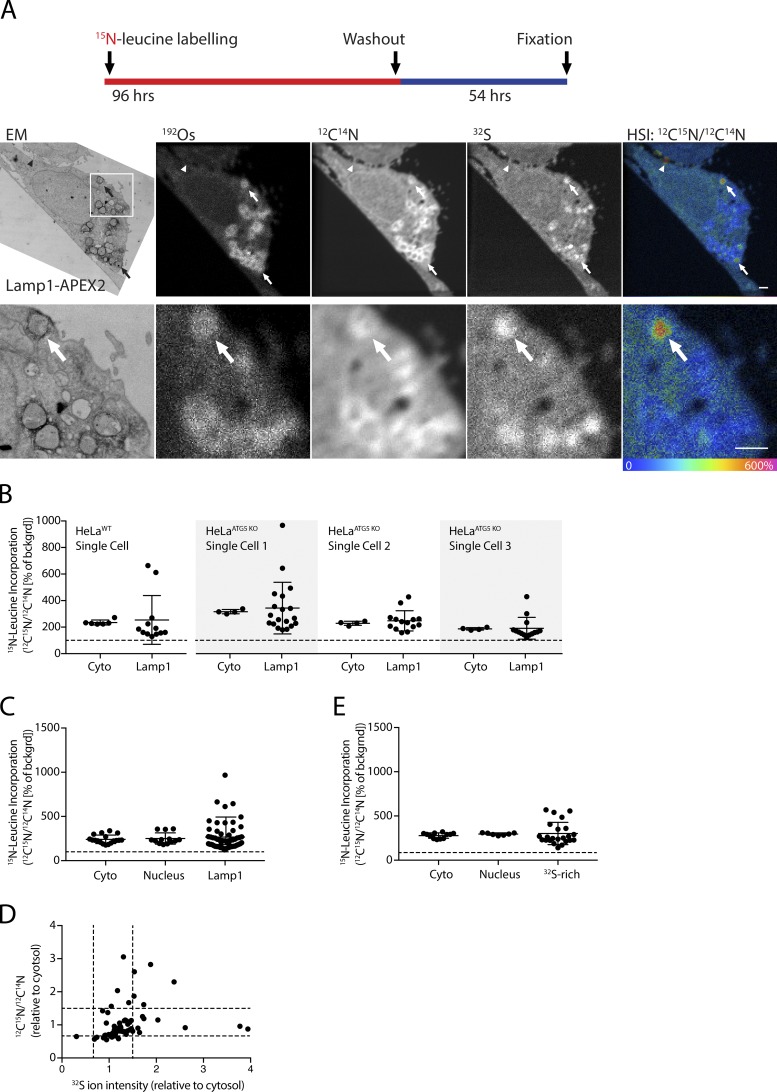
Figure 6.
15N-leucine incorporation is heterogeneous among lysosomes in single HeLa cells. (A) Images of HeLa cells expressing Lamp1-APEX2 metabolically labeled with 15N-leucine for 4 d before washout for 54 h and fixation. Arrows indicate lysosomes with high incorporation of 15N-leucine. Arrowhead indicates a filipodia, which also exhibits high 15N-leucine incorporation. HSI image represents the 12C15N/12C14N ratio as a hue and ion counts as an intensity for each pixel. Representative images from a single cell are shown. (B) Quantification of 15N-leucine incorporation into areas of cytosol or individual Lamp1-APEX2–positive lysosomes for single cells treated as described in A. (C) Quantification of 15N-leucine incorporation into areas of cytosol, nucleus, or individual lysosomes (identified by Lamp1-APEX2 labeling) for experiment described in A. Dotted line indicates natural abundance of 12C15N relative to 12C14N. In B and C, four cells (one HeLaWT and three HeLa ATG5 KO) were analyzed (in two technical and one biological replicates). (D) Incorporation of 15N-leucine and 32S abundance of individual lysosomes in experiment described in A. Four cells (one HeLaWT and three HeLaATG5 KO) were analyzed (in two technical and one biological replicates). (E) HeLa cells expressing mito-APEX2 were labeled as in A and 15N-leucine incorporation into areas of cytosol, nucleus, or individual lysosomes (identified by 32S intensity) was measured. Dotted line indicates natural abundance of 12C15N relative to 12C14N. A total of three HeLaWT cells were analyzed (in one technical/biological replicate). Error bars in all graphs represent SD. Scale bar in all images = 1 µm.

