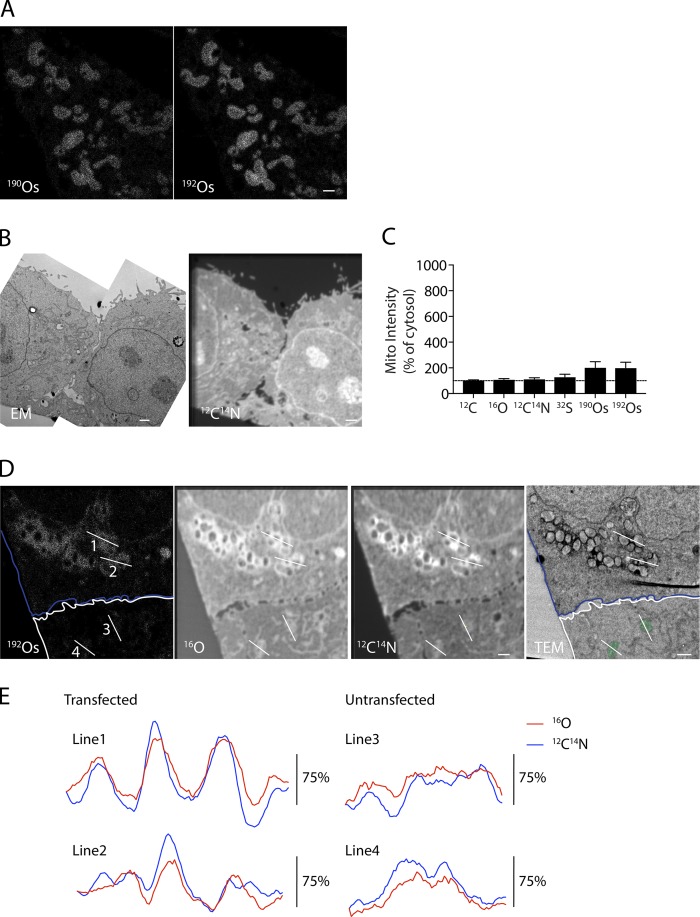
Figure S1.
Detection of APEX2 by MIMS. (A) 190Os (left) and 192Os (right) MIMS images of HeLa cells expressing Mito-APEX2. 192Os panel, which is the same as in Fig. 1 B, is reproduced for clarity. (B and C) Correlated TEM and 12C14N MIMS images of an untransfected HeLa cell. Panels are the same as in Fig. 1 B, reproduced for clarity. (C) Quantification of indicated ion intensities for individual mitochondria relative to cytosol in an untransfected HeLa cell. For this analysis, eight mitochondria from a representative untransfected cell were measured. Error bars represent SD. (D) Field with APEX2-Parkin transfected cell (blue outline) and untransfected cell (white outline) treated with the mitochondrial uncoupler carbonyl cyanide m-chlorophenyl hydrazone (CCCP) to recruit APEX2-Parkin to the outer mitochondrial membrane. Lines in D indicate position of line scans in E through APEX2-Parkin–labeled mitochondria (lines 1 and 2) and mitochondria identifiable in the 16O image in the absence of a protein marker. Scale bars = 1 µm.

