Figure 2.
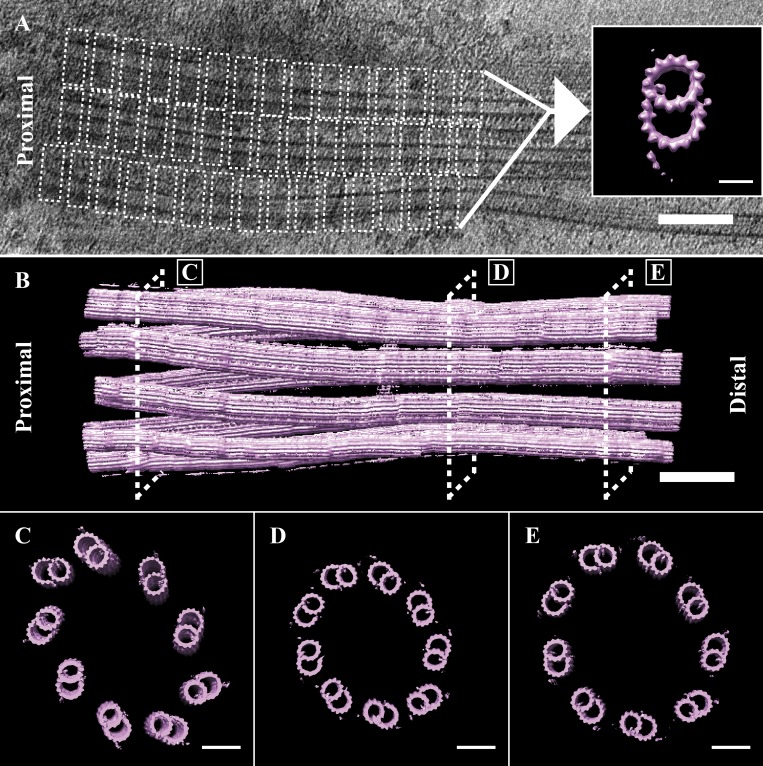
The transition from BB to axonemal geometry. (A) Subvolumes of the proximal 800 nm of the cilium, containing both TMTs and DMTs. DMTs were extracted (dashed boxes), aligned, and averaged to generate a global microtubule map of a DMT (inset). (B) The map was then refitted back into a tomogram to rebuild a whole cilium. (C–E) From this refit, we took cross sections (dashed boxes) that showed the geometry changes that occur along the proximal–distal axis. (C) The MTs at the proximal cilium were not parallel, but rather angled out with respect to each other. (D) By the constriction point at ∼500 nm in, the MTs had adopted a more in-line geometry, and adjacent DMTs were closer together. (E). The diameter then expanded such that by ∼800 nm in, the geometry of the cilium was axonemal. Scale bars are 100 nm (A and B); 50 nm (C–E).

