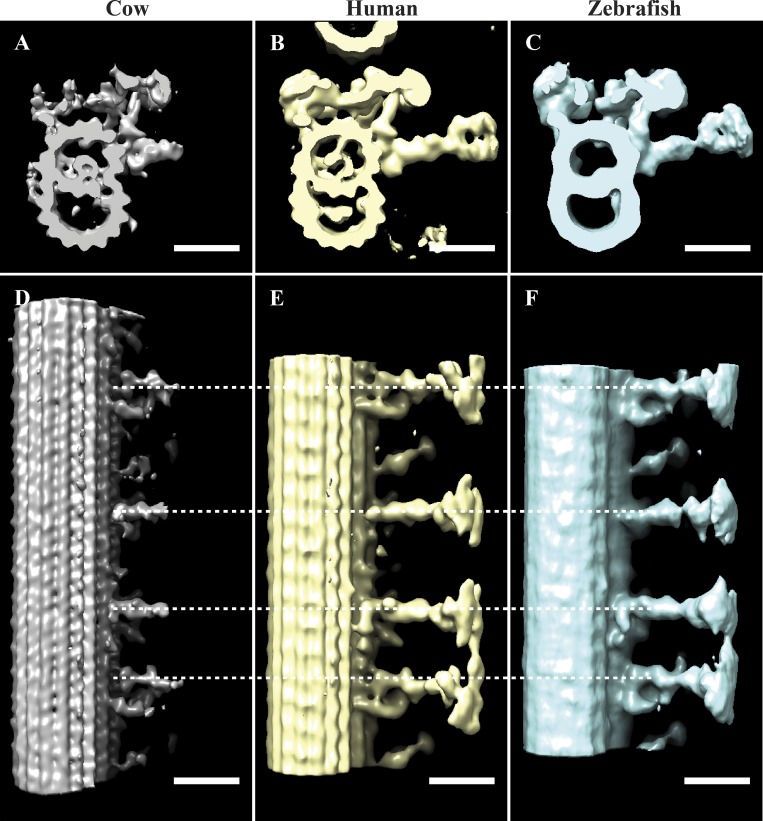
Figure S3.
Comparing axoneme structures. (A–C) We compared the structural features from our bovine axoneme average (EMD-20674; A) to those of published axonemes from human (EMD-5950, Lin et al., 2014; B) and zebrafish (EMD-6954, Yamaguchi et al., 2018; C). The shape and position of the ODAs, IDAs, and RS are consistent between maps. The cylinder-shaped density that we identified within the lumen of the A-tubule (A) is also observed in the human map (B) but is not obvious in the zebrafish map (C). (D–F) When viewed from the side, the periodicities and shapes of the RS are the same for all maps, although our average lacks the RS heads. Scale bars are 25 nm.

