Figure 3.
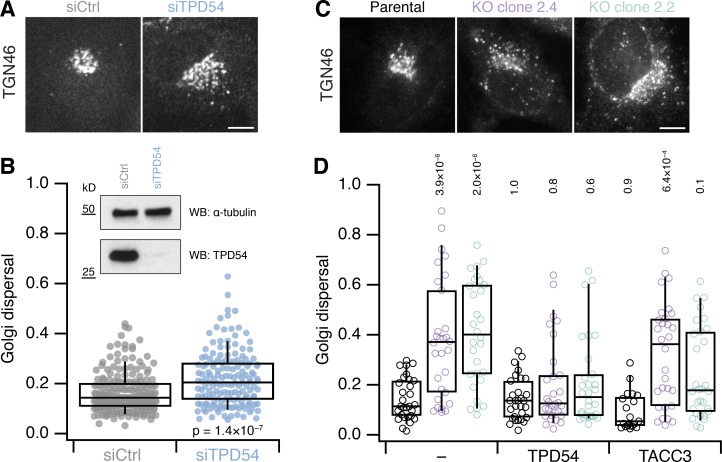
Golgi dispersal in cells lacking TPD54. (A) Micrographs of TGN46 distribution in HeLa cells treated with siCtrl (GL2) or siTPD54 (TPD54 RNAi). Scale bar, 10 µm. (B) Quantification of Golgi dispersal in control and TPD54-depleted cells. Golgi dispersal is the area of a convex hull of the TGN46 signal as a fraction of the total cell area. ncell = 155−197, nexp = 3. Inset, Western blot to show knockdown efficiency. (C) Micrographs of TGN46 distribution in parental HeLa cells and two clones with targeted disruption of the TPD54 locus (2.4 and 2.2). Scale bar, 10 µm. (D) Quantification of Golgi dispersal in each clone compared with parental cells. FLAG-TPD54 and FLAG-TACC3 was expressed as indicated; − indicates no reexpression. Dots represent individual cells, boxes show interquartile range, bars represents the median, and whiskers show 9th and 91st percentiles. ncell = 19−30, nexp = 3. The P values shown are from Wilcoxon rank sum test (B) or Dunnett’s multicomparison test compared with control with no reexpression (D). KO, knockout.

