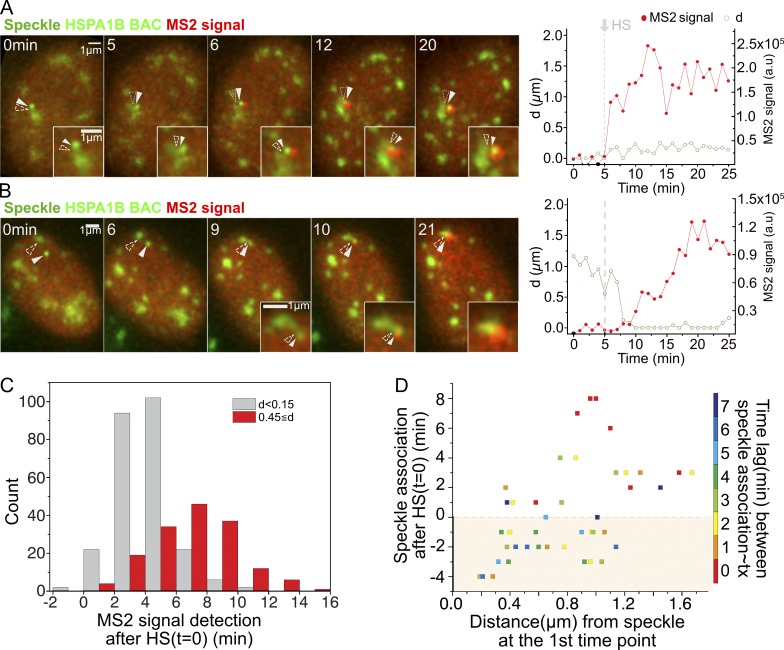
Figure 3.
Strict temporal correlation between speckle association and HSPA1B transcriptional amplification. (A and B) Left: Transgene location (solid arrowheads), nuclear speckles (open arrowheads), and MS2 signal versus time (minutes) after start of observation (heating on at 1 min, stable HS temperature [HS-T] reached at 5 min). Right: Distance (d) of Hsp70 transgene/nascent transcript from closest speckle (green) and nascent RNA level (red). (A) Transgene associated with speckle throughout HS (category 1, 146/438 cells). MS2 signal appears 1 min after reaching HS-T at 5 min (Video 1). (B) Transgene initially unassociated with speckle (category 2, 41/438 cells). MS2 signal appears at 10 min, ∼5 min after reaching HS-T and ∼1 min after moving to and contacting speckle (Video 2). (C) Histogram showing time of MS2 signal appearance after reaching HS-T for transgenes initially speckle associated (gray, n = 251) versus non–speckle associated (red, n = 159). MS2 signal delayed ∼3 min when not associated (mean = 6.5 min) versus associated (mean = 3.6 min). P = 2.2 × 10⁻¹⁶; paired t test. (D) Scatterplot showing timing of speckle–transgene association after reaching HS-T versus initial transgene distance to speckle versus time lag (color) between speckle–gene association and appearance of MS2 signal (n = 42 displayed). Time lags: mean = 3.8 min, typically 0–3 min after reaching HS-T.

