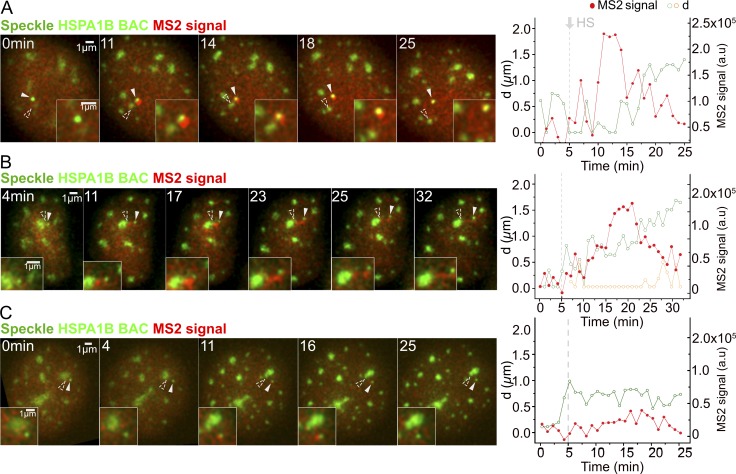
Figure 4.
Temporal correlation between speckle dissociation and decrease in HSPA1B transcription. Display and labeling is the same as in Fig. 3 (A and B). (A) HSPA1B transgene disassociating from speckle (category 3, 28/438 cells). Nascent transcripts decrease and then disappear after transgene separates from speckle (Video 3). (B) HSPA1B transgene disassociating from speckle. d, distance of HSPA1B transgene (green) or nascent transcript (orange) from closest speckle (2/28 cells falling in category 3). Nascent transcripts accumulate in elongated connection between speckle and transgene after their separation (Video 4). (C) No speckle association of HSPA1B transgene after HS (5/438 cells). MS2 signal sometimes transiently rises slightly above background but does not persist.

