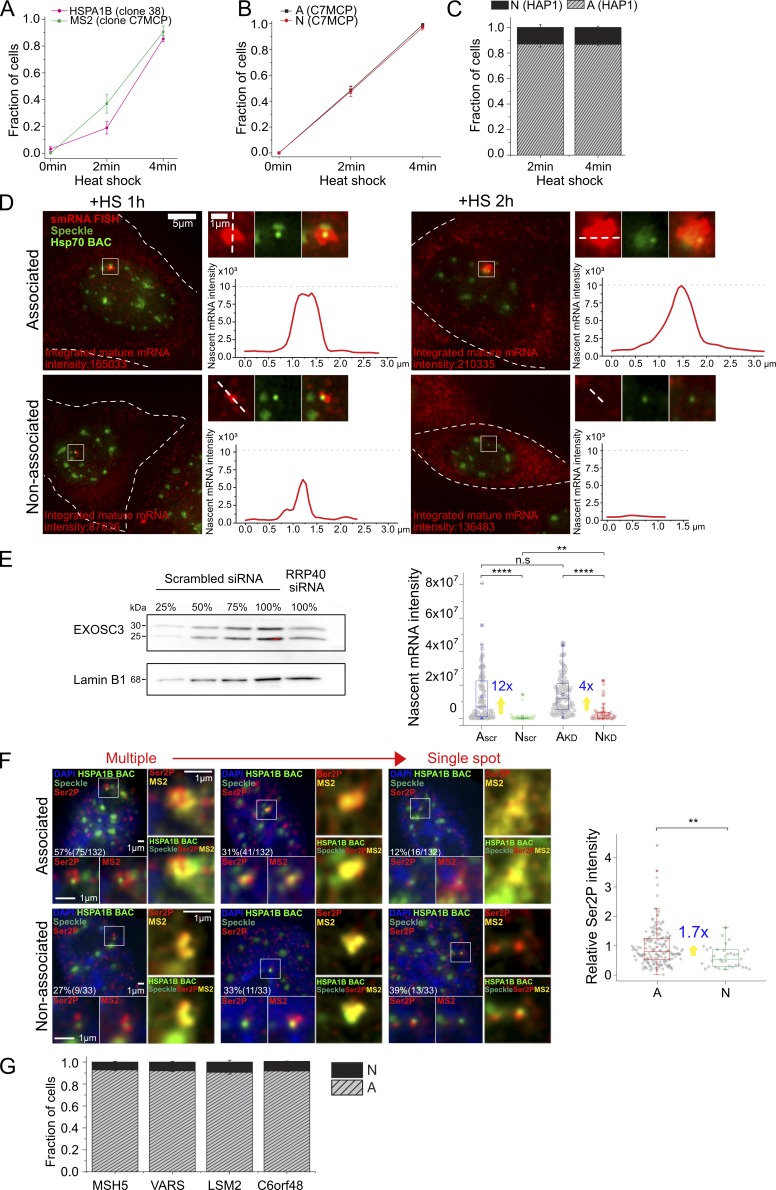
Figure S2.
Various supporting data. (A) Transcriptional induction of HSPA1B BAC transgene without MS2 repeats in CHO DG44 cells detected by smRNA FISH against HSPA1B (clone 38, percentage ± SD estimate, n = 42 to 46 each time point, magenta) and of HSPA1B BAC with MS2 repeats in CHOK1 cells detected by smRNA FISH against MS2 (clone C7MCP, percentage ± SD estimate, n = 74 to 96 each time point, green). Full induction occurs 2–4 min after HS in both. (B) Transcriptional induction of speckle-associated (A) and non–speckle-associated (N) HSPA1B BAC transgene in CHOK1 cells (clone C7MCP). Both A and N are induced within 0–4 min after HS (percentage ± SD estimate, n = 360, 211 observed for A; n = 147, 69 for N). (C) Histogram showing fraction of endogenous Hsp70 alleles in HAP1 cells upon speckle association or non–speckle association after 2- and 4-min HS (mean ± SEM, three replicates). At 2-min HS, n = ∼100, 38% activated cells on average among observed 201 to 360 cells, and at 4-min HS, n = 70 to 111, 96.8% activated cells on average among observed 70 to 120 cells for each replicate. (D) Whole-cell images of nucleus shown in Fig. 1 D (left) and intensity profile of nascent mRNA transcripts at HSPA1B BAC transgene locus (right). Integrated mature mRNA signal is proportional to nascent mRNA signal as in Fig. 1 B. Left: White dashes outline cell border. Right, top: Image of nascent transcripts in red, HSPA1B BAC in light green and nuclear speckle in green, and merge. Right, bottom: Intensity profile of nascent transcript measured along the white dash line in top image. Intensities scaled nonlinearly in images to reduce red channel intensity dynamic range (left) but linearly for line scans. (E) Nascent mRNA level change after EXOSC3 knockdown at 1-h HS. Left: Immunoblotting with EXOSC3 antibody to estimate the percentage of knockdown. The EXOSC3 protein in the knockdown samples (100%, RRP40 siRNA treated) was estimated against different percentages (25, 50, 75, and 100%) of scrambled siRNA-treated cell lysates. Lamin B1 was used as the loading control. Right: Boxplot of nascent mRNA intensity (smRNA FISH) at A and N locus for scrambled siRNA or RRP40 siRNA–treated cells with fold differences (blue) of mean for A versus N. Mean (square inside box), median (line inside box), box (interquartile range), ends of error bars (upper and lower limit), × (top: 99%, bottom: 1%), – (top: maximum, bottom: minimum). **, P < 0.01; ****, P < 0.0001; n.s, not significant; paired Wilcoxon signed-rank test. n = 107 and 39 observed for A and N in scrambled; 106 and 43 for RRP40 siRNA–treated cells. (F) RNA polII phosphorylated on serine 2 (Ser2P) and MS2MCP-mCherry signal at 1-h HS. Left: Representative images of Ser2P polII (red, bottom left and right) signals and MS2 signals (red, bottom right, and yellow, right) for BAC transgene (light green) associated (top) versus not associated (bottom) with nuclear speckles (green). Right: Boxplot of relative Ser2P normalized by mean Ser2P intensity of A with fold differences (blue) of mean for A versus N. **, P < 0.01; paired Wilcoxon signed-rank test. n = 165 and 33 observed for A and N. (G) Histograms showing fraction of endogenous Hsp70 flanking gene alleles in HAP1 cells at varying distances from the nuclear speckle (mean ± SEM, three experimental replicates, n = 128 to 289 activated loci observed in each experiment. Scale bars = 1 µm (D, enlarged panels, and F) or 5 µm (D) .

