Figure 1.
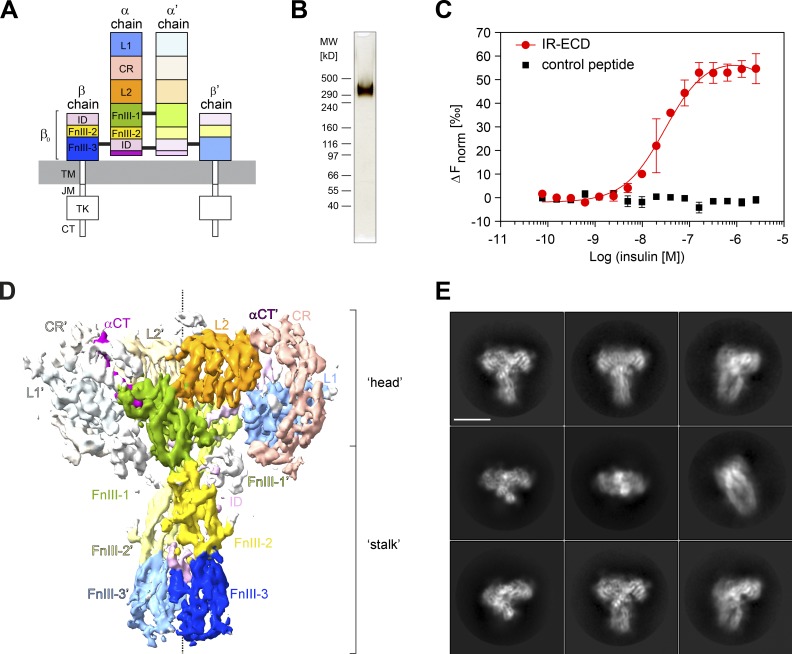
IR-ECD purification and cryo-EM. (A) Scheme of IR domain architecture. L1 and L2, leucine-rich repeat domains 1 and 2; CR, cysteine-rich domain; FnIII-1, -2, -3, fibronectin type-III domains 1, 2, 3; TM, transmembrane; JM, juxtamembrane; TK, tyrosine kinase domain; CT, C-terminal tail. The α C-terminal regions (αCT and αCT′) are drawn in purple. Black lines indicate intersubunit disulfide bonds. A prime (′) denotes the chain, domain, or residue within the second protomer. (B) Purified dimeric IR-ECD (IR(αβ0)2) migrates as a single band with an apparent molecular weight of 351 kD on a nonreducing 3–8% Tris-acetate SDS-PAGE gel as visualized by silver staining. (C) Equilibrium binding to native human insulin in solution was assessed by MST of IR-ECD after Tris-NTA-RED labeling. An 8xHis-tagged control peptide served as negative control to rule out unspecific binding or interference with the Tris-NTA-RED dye (Fig. S1 H). The normalized fluorescence difference (ΔFnorm) is plotted against ligand concentration. Error bars display standard deviations; n = 3. (D) Front view of the IR-ECD cryo-EM density map saturated with insulin ligands at 4.3 Å estimated nominal global resolution. Subdomains are colored as in A. (E) Representative 2D class averages of particles contributing to the reconstruction in D of the IR-ECD exposed to human insulin. Scale bar, 10 nm.

