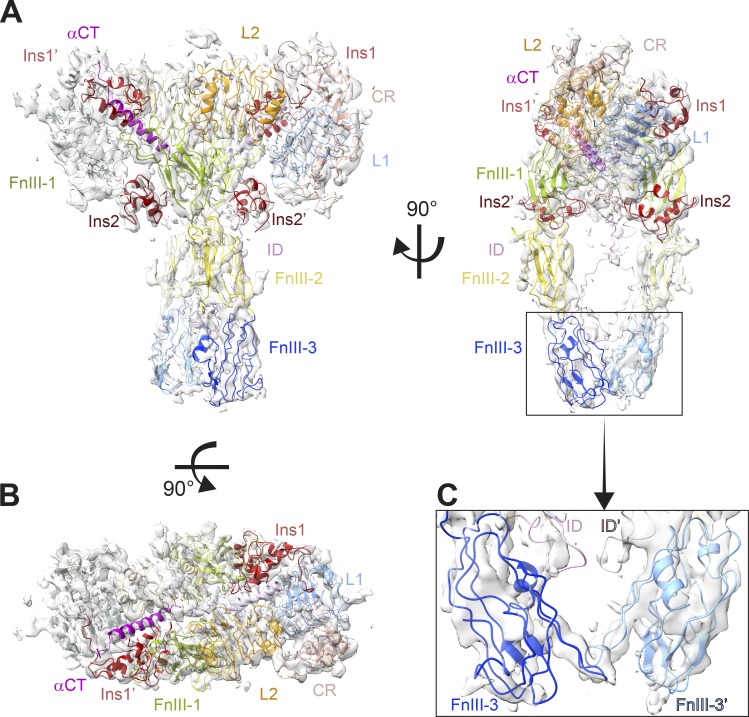
Figure 2.
Cryo-EM structure of the ligand-saturated IR-ECD. (A and B) Orthogonal views of the cryo-EM map and structure of the IR-ECD dimer complex. (C) Close-up of the membrane-proximal FnIII-3 domains. The color code for the individual domains in all panels is as in Fig. 1; the four insulin moieties are depicted in red.

