Figure 3.
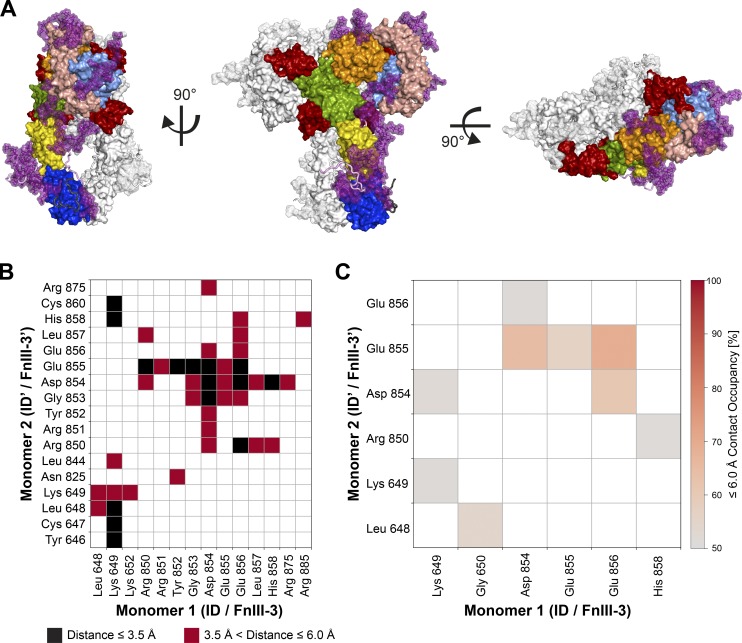
MD simulations of insulin-saturated IR-ECD and interactions of membrane-proximal domains. (A) Orthogonal views of the complete insulin–IR-ECD starting model used for MD simulations in surface representation. One monomer is color-coded as in Fig. 1 with carbohydrates in purple and the insulin moieties in red. The second monomer is depicted in white. The disordered ID and C-terminal linker plus tag are shown in cartoon style colored in light violet and dark gray, respectively. (B) Contact map calculated from our cryo-EM structure showing interactions between ID/FnIII-3 domains of both monomers with contact cutoffs set to ≤3.5 Å (black) and ≤6 Å (red). (C) Contact occupancies calculated from MD simulations with the cutoff at 6 Å. Only contacts of ≥50% occupancy are displayed.

