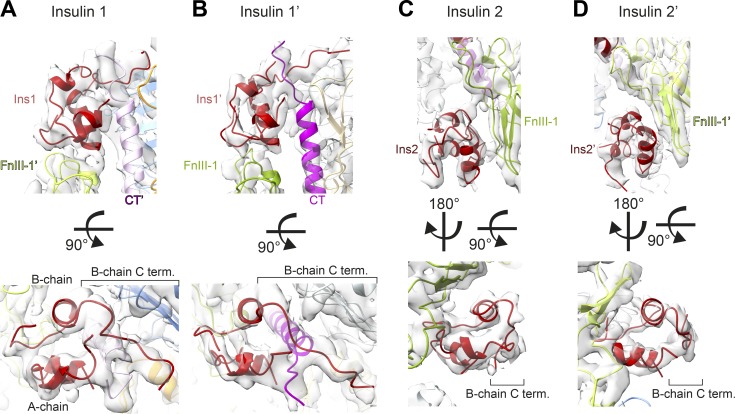
Figure 4.
Binding sites and conformations of insulins bound to IR-ECD. (A–D) The cryo-EM density map and structure in close-up views of the four insulins and their receptor binding sites are displayed: insulin 1 (A), insulin 1′ (B), insulin 2 (C), and insulin 2′ (D). Insulin structures are aligned below for comparison illustrating the open conformation of site-1-bound insulins with a detached C-terminal B-chain segment in contrast to the closed conformation at site 2. Individual domains in all panels are colored as in Figs. 1 and 2.

