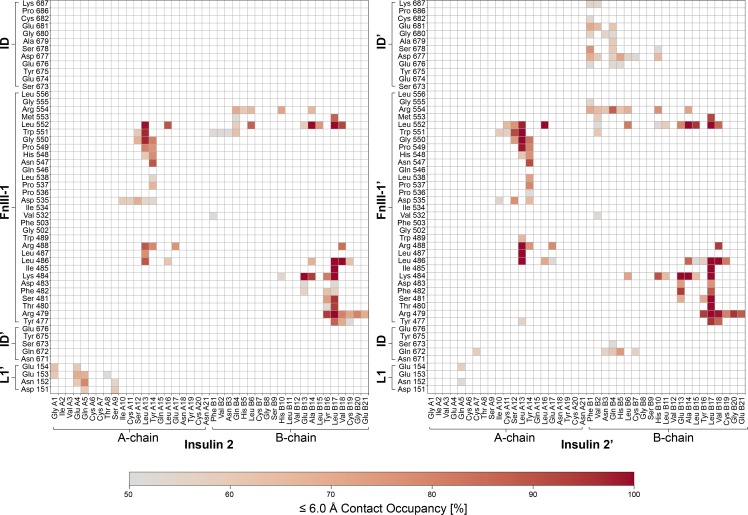
Figure 5.
Characterization of the novel insulin binding sites 2 and 2′ interactions by MD simulations. Contact occupancies for insulin–IR-ECD interactions derived from our 10 × 500-ns MD simulations with a cutoff of 6.5 Å are depicted for insulin 2 (left) and insulin 2′ (right). Only contacts with an occupancy of ≥50% are displayed. See Figs. S5, S6, and S7 for contact maps comparing all insulin ligands in our cryo-EM structure and MD simulations.

