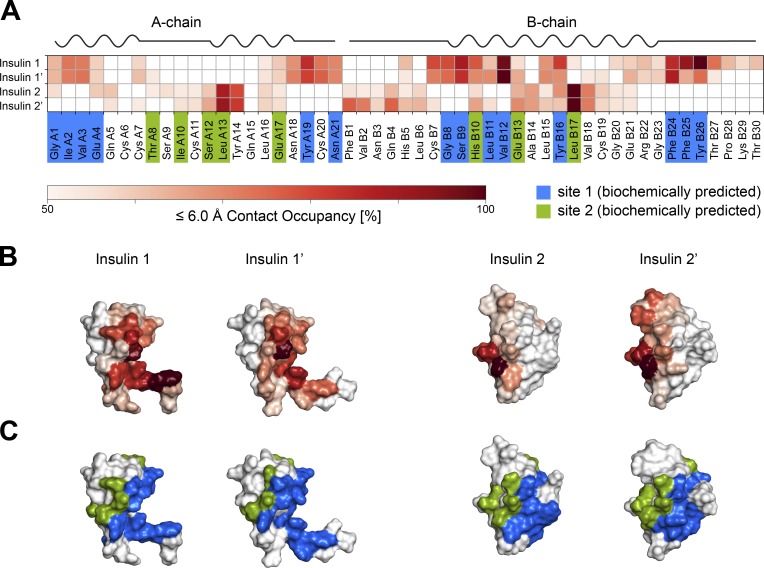
Figure 6.
Interactions of insulin with the IR-ECD binding sites 1 and 2. (A) Summary of per residue contact occupancies of the four insulins bound to IR-ECD in the MD simulations. The contact occupancies are encoded by shades of red. Only contacts of ≥50% occupancy are displayed. Residues shown previously to contribute to interactions with IR-ECD site 1 and site 2 in biochemical experiments are highlighted in blue and green, respectively. The secondary structure of human insulin is drawn schematically above the contact map (based on PDB 3I3Z). (B) Contact occupancies color-coded as in A are plotted on the structural models of the four insulins bound to the IR-ECD. (C) This is juxtaposed with coloring of biochemically predicted site 1 and site 2 residues in blue and green, respectively.

