Figure S1.
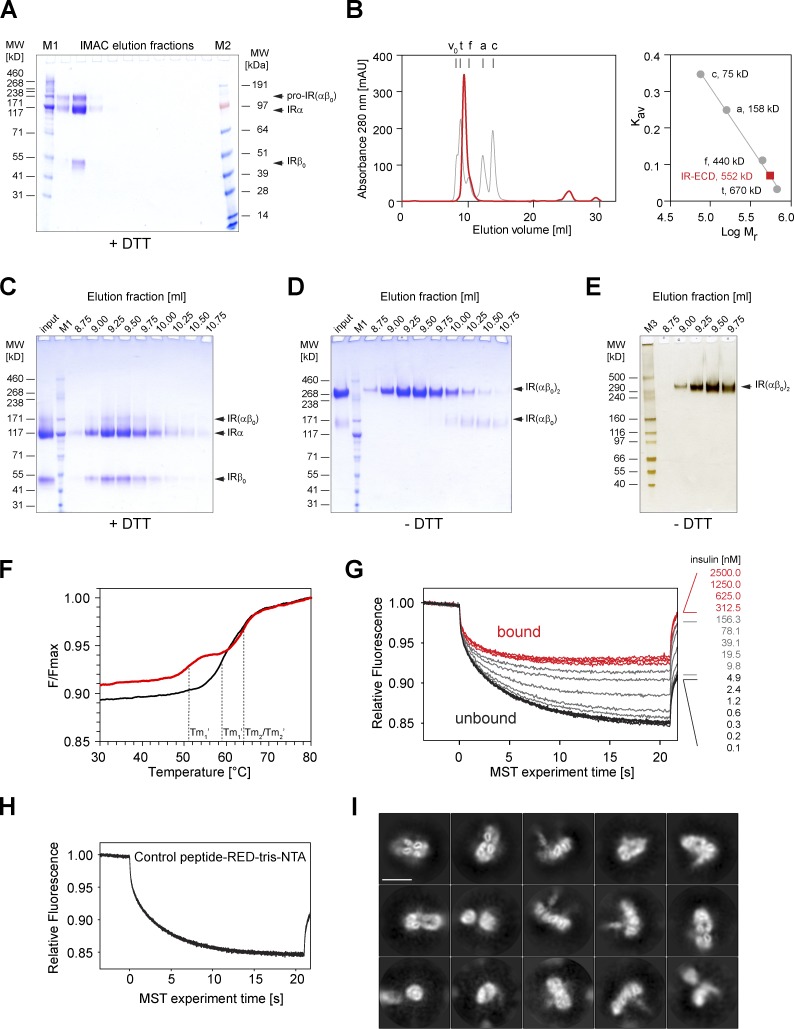
Purification and biochemical characterization of IR-ECD. (A) Coomassie G-250 Brilliant Blue–stained 4–12% Bis-Tris gel run in MOPS buffer of the IMAC elution fractions under reducing conditions. (B) The peak fraction containing IR-ECD was further purified by size exclusion chromatography on a Superdex 200 Increase 10/300 GL column. The void volume (v0) and elution volumes of the standards bovine thyroid thyroglobulin (t), horse spleen ferritin (f), rabbit muscle aldolase (a), and egg white conalbumin (c) are indicated. The partition coefficient (Kav) is plotted against the logarithm of molecular weight for standards (right) to determine the IR-ECD apparent molecular weight, which is considerably larger than in denaturing SDS-PAGE, presumably due to its elongated shape in solution. (C and D) Samples of eluted fractions were analyzed by SDS-PAGE on 3–8% Tris-Acetate gels under reducing (C) and nonreducing (D) conditions, stained with Coomassie G-250 BrilliantBlue. (E) Silver-stained 3–8% Tris-Acetate SDS-PAGE gel corresponding to the single lane shown in Fig. 1 B. The apparent molecular weight was estimated to be 351 kD for IR-ECD (IR(αβ0)2), 120–130 kD for the α subunit (IRα), and 50–54 kD for the extracellular IR β (IRβ0) subunit as estimated with HiMark unstained protein standards (M3). Other markers used here were HiMark prestained protein standard (M1) and SeeBlue Plus2 prestained protein standard (M2). (F) Thermal unfolding of IR-ECD was assessed in the absence (black) or presence (red) of 50 µM human insulin by recording intrinsic tryptophan autofluorescence ratios at 350 and 330 nm. The plot shows temperature-dependent normalized tryptophan autofluorescence. The melting temperatures in the absence of insulin (Tm1, Tm2) and in the presence of insulin (Tm1′, Tm2′) are indicated. (G) Representative MST traces of 10 nM IR-ECD (labeled with RED-Tris-NTA) after exposure to insulin. Native insulin at concentrations from 2.5 µM to 76 pM was titrated against 10 nM soluble RED-Tris-NTA–labeled IR-ECD. The corresponding dose–response curve is plotted in Fig. 1 C. (H) To rule out nonspecific interactions or interference with the labeling strategy, MST traces of a synthetic control peptide labeled with RED-Tris-NTA were recorded after exposure to insulin (same concentrations as in G) and confirmed not to interact with insulin at concentrations ≤2.5 µM. (I) 2D class averages of the apo-IR-ECD obtained by cryo-EM. Scale bar, 10 nm.

