Figure S3.
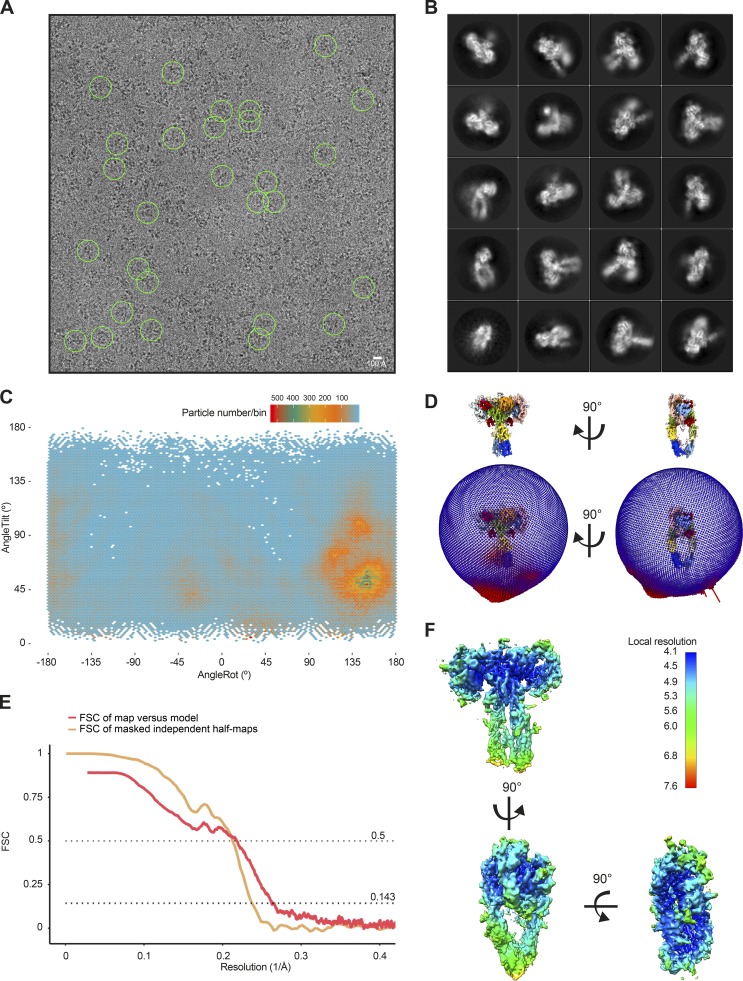
Single-particle cryo-EM analysis of the insulin–IR-ECD complex. (A) Representative micrographs of the insulin–IR-ECD dataset. The scale bar in the cryo-EM micrograph corresponds to 100 Å, and the green circles (260-Å diameter) indicate particles contributing to the final reconstruction with a nominal global resolution of 4.3 Å (see Fig. S2). (B) Reference-free 2D class averages of the insulin–IR-ECD complex from an initial 2D classification run (see Fig. S2 for details). Some structural heterogeneity is apparent, especially in the stalk region. (C) Angular distribution of particles contributing to insulin–IR-ECD complex reconstruction. Tilt and rotation angles were plotted against each other for the final 4.3-Å 3D reconstruction. The color of each sampling bin indicates the number of particles in the respective bin. (D) In the spherical angular distribution representation, blue denotes fewer, and red more, particles (326,257 particles in total). (E) FSC of masked independent half-maps and of map-versus-model of the final insulin–IR-ECD reconstructions used for modeling and structure interpretation (see Fig. S2 for details). The nominal global resolution of the full insulin–IR-ECD complex was determined to be 4.3 Å according to the 0.143 cutoff criterion (Rosenthal and Henderson, 2003). Map-to-model correlation showed agreement at the 0.5 cutoff criterion to 4.6 Å. (F) Map of the insulin–IR-ECD complex colored according to local resolution estimate. The central parts of the head are resolved at higher resolution, whereas distal parts of the stalks are resolved at lower resolution.

