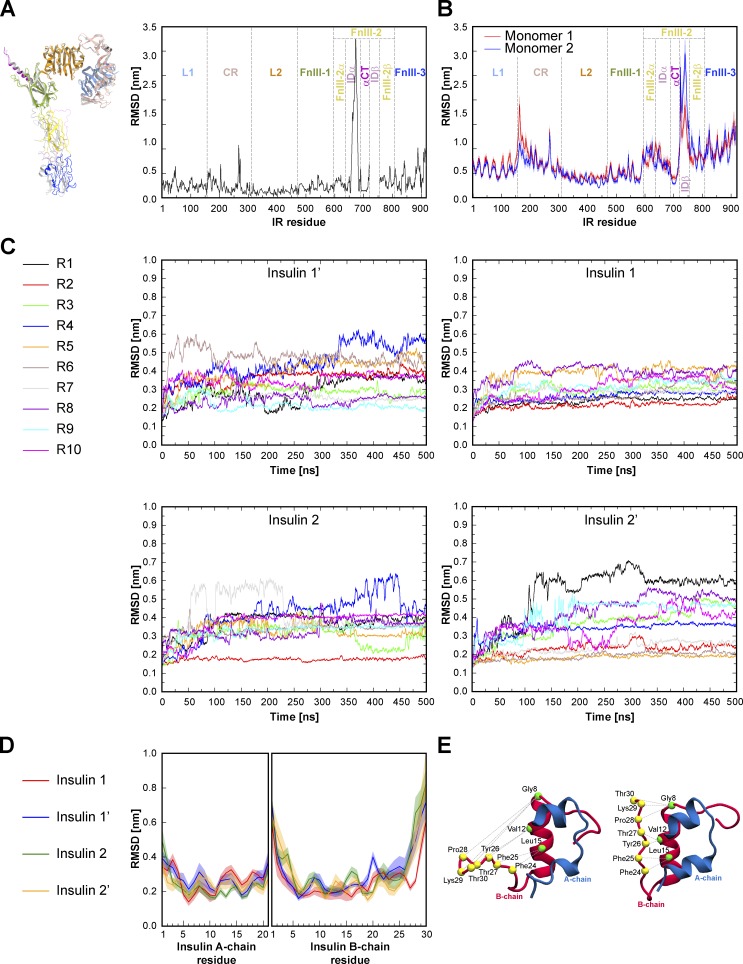
Figure S4.
Structural asymmetries in the cryo-EM structure and MD simulations of the ligand-saturated IR-ECD. (A) Asymmetries depicted in our cryo-EM structure. The panel on the left shows the two superimposed IR monomers. Monomer 1 domains are colored as in Fig. 1, and monomer 2 is colored in gray. The corresponding per-residue plot of the backbone RMSD between the two monomers is shown on the right. Individual domains are separated by dashed bold lines. (B) Backbone RMSD measured for IR residues averaged from 10 MD simulations. Red and blue lines indicate monomer 1 and 2, respectively. RMSDs were calculated over 500 ns with respect to the starting MD model. (C) Time-dependent backbone RMSD for the four bound insulins determined from 10 MD simulation repeats (R1–R10). RMSDs were calculated with respect to the initial MD model. (D) RMSD determined for insulin residues calculated with respect to the initial MD model and averaged over 10 MD simulation runs. (E) To monitor the B-chain C terminus dynamics, we recorded the distance between residues in the B-chain α helix and residues within the B-chain C terminus as indicated above with dashed lines. Cryo-EM structures of insulin 1 in the open conformation (left) and insulin 2 in the closed conformation (right) are displayed in cartoon representation. See Table S4 for the corresponding distance measurements from the cryo-EM structure and from MD simulations. Standard error of the mean for B and D are indicated as shadows.

