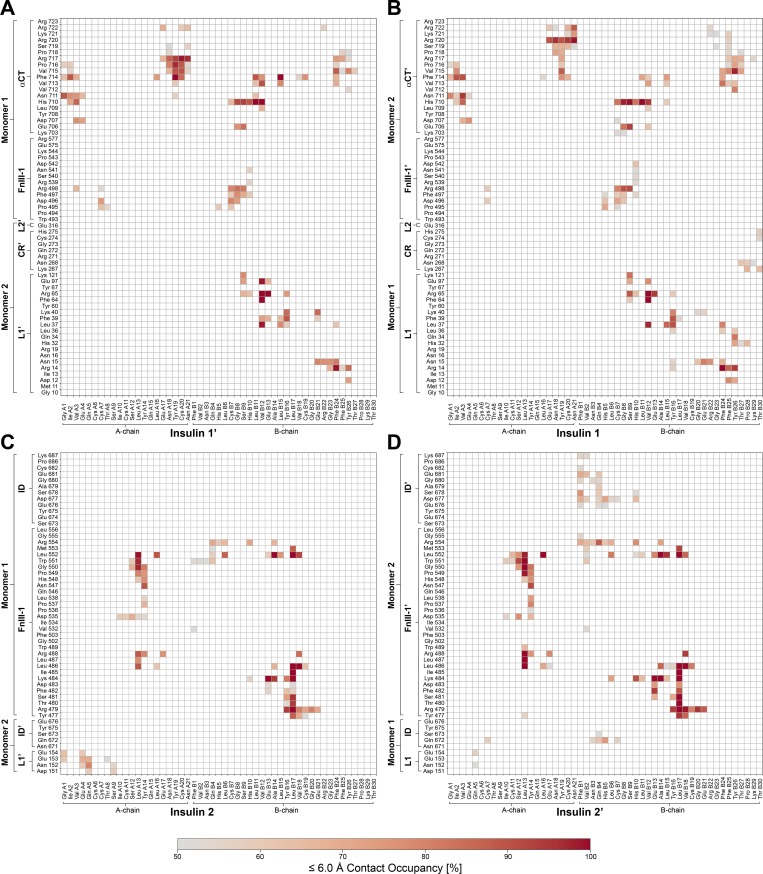
Figure S7.
Contact occupancies for insulin–IR-ECD interactions with a cutoff of 6.0 Å from MD simulations. (A–D) Contact map showing interactions between IR-ECD and head-bound insulins 1′/1 (A and B) and stalk-bound insulins 2/2′ (C and D). Only contacts with an occupancy >50% are displayed. The arrangement of the maps corresponds to the location of the respective insulin in the ECD (front view).

