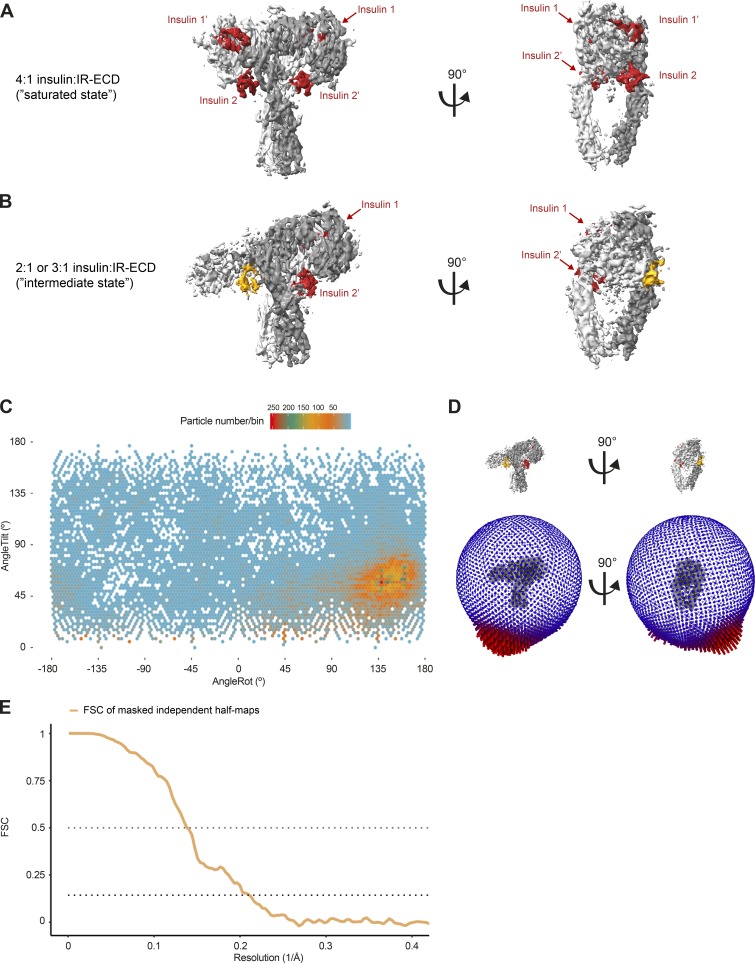
Figure S8.
Cryo-EM analysis of the insulin–IR-ECD intermediate state. (A and B) Front and side views of the 3D density maps of the saturated state bound to four insulins (A) and the intermediate state bound to at least two insulins (B). Densities corresponding to the first and second IRαβ0 protomers are colored in gray and white, respectively. Insulin moieties are depicted in red. For our intermediate state reconstruction, we could unambiguously assign insulin 1 and 2′ (in red). A density juxtaposed to binding site 2 (yellow) might correspond to insulin, but is insufficiently resolved to exclude it from corresponding to the receptor, such as the αCT peptide. We cautiously assign the intermediate state reconstruction as a two- or three-insulin–bound structural intermediate. The domains in the receptor head lacking insulin are strikingly tilted, and the FnIII-3 domains converge. (C) Angular distribution of particles contributing to the intermediate state reconstruction. Tilt and rotation angles were plotted against each other for the final intermediate state 3D reconstruction. The color of each sampling bin indicates the number of particles in the respective bin. (D) In the spherical angular distribution representation, blue denotes fewer, and red more, particles (50,079 particles in total). AngleRot, rotation angle. (E) FSC of masked independent half-maps of the final intermediate state map. The nominal global resolution of the intermediate state reconstruction was 5.0 Å according to the 0.143 cutoff criterion (Rosenthal and Henderson, 2003). This is most likely an overestimate due to the anisotropy in the distribution of views. For ease of interpretation, both the 0.5 and 0.143 cutoffs are indicated by dotted lines.

