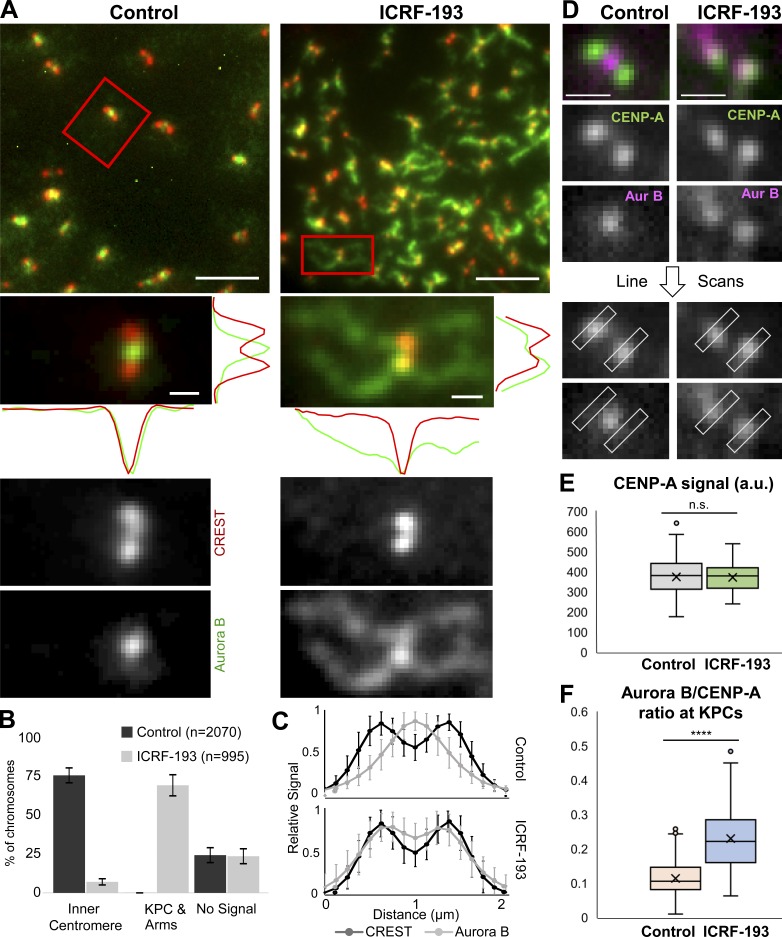
Figure 5.
Aurora B recruitment to KPCs and chromosome arms during ICRF-193 treatment in HeLa cells. (A) Representative immunofluorescent-stained images of pseudometaphase cells (nocodazole arrested) ± ICRF-193 treatment for 45 min. CREST, red; Aurora B, green. Line scans were done in the x and y axis. Bars, 10 µm (insets, 1 µm). (B) Quantification of immunofluorescent staining at centromeres/chromosome arms. Error bars, standard deviation. (C) Averaged plots of Aurora B and CREST signal intensities in line scans across centromeres in cells treated as in A. Each scan was normalized to the highest value. Control, n = 52 chromosomes from 25 cells; ICRF, n = 50 chromosomes from 31 cells. (D) Images showing line scans of Aurora B and CENP-A perpendicular to the kinetochore–kinetochore axis in metaphase cells (no nocodazole). Bars, 1 µm. (E) Quantification of peak CENP-A signals from D. Control, n = 15 cells and n = 124 kinetochores; ICRF-193, n = 12 cells and n = 44 kinetochores; P = 0.85. Data collected from three independent experiments. P values from Student’s t test. n.s., not significant. (F) Quantification of Aurora B/CENP-A ratios from D. Control, n = 40 cells and n = 204 kinetochores; ICRF-193, n = 42 cells and n = 172 kinetochores; ****, P = 2 × 10−39. Data collected from at least three independent experiments. P values from Student’s t test. All error bars, standard deviation.

