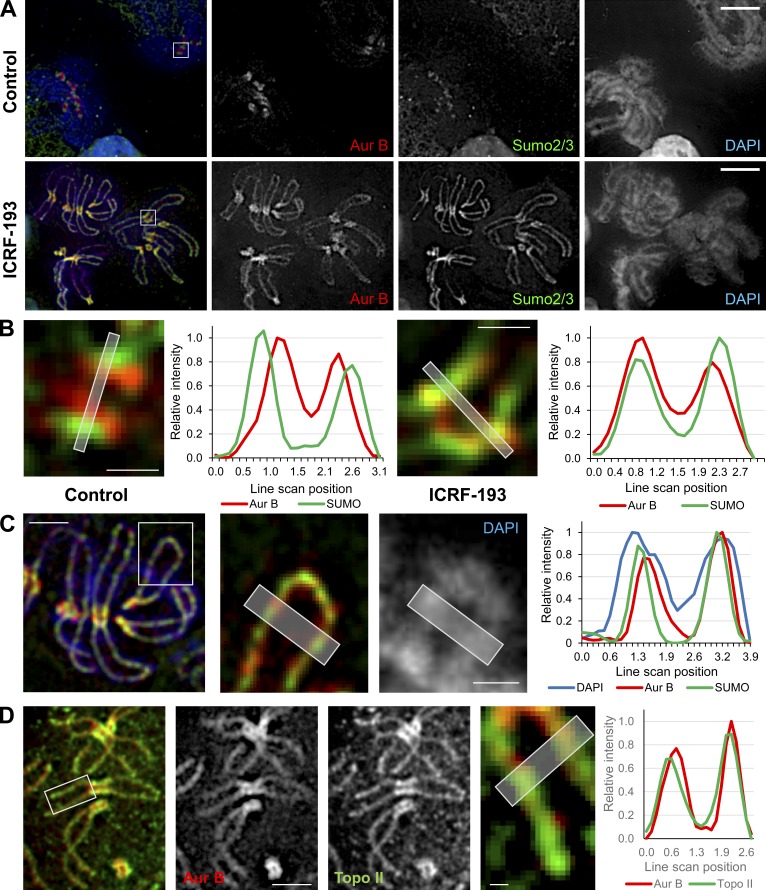
Figure 9.
Aurora B and SUMO2/3 are recruited to the chromosome core upon Topo II catalytic inhibition. Representative immunofluorescent-stained images of M. muntjak cells arrested in mitosis with nocodazole then treated ± ICRF-193 for 45 min. The experiment was performed at least three times, and the images shown are a true representation of the staining patterns that were consistently observed. (A) Aurora B, red; SUMO2/3, green; DAPI (DNA), blue. Bars, 10 µm. (B) Magnification of kinetochores from boxed regions in A. Bars, 1 µm. (C) Right: Magnified chromosome arms from the boxed region in the image on the left. Bar, 4 µm (inset, 2 µm). (D) Aurora B, red; Topo IIα, green. Bars, 5 µm (inset, 0.5 µm). In B–D, the histogram plots show average signal intensities of a 5-pixel-wide line scan across the planes indicated in the magnified images. The line scans are representative examples from three independent experiments.

