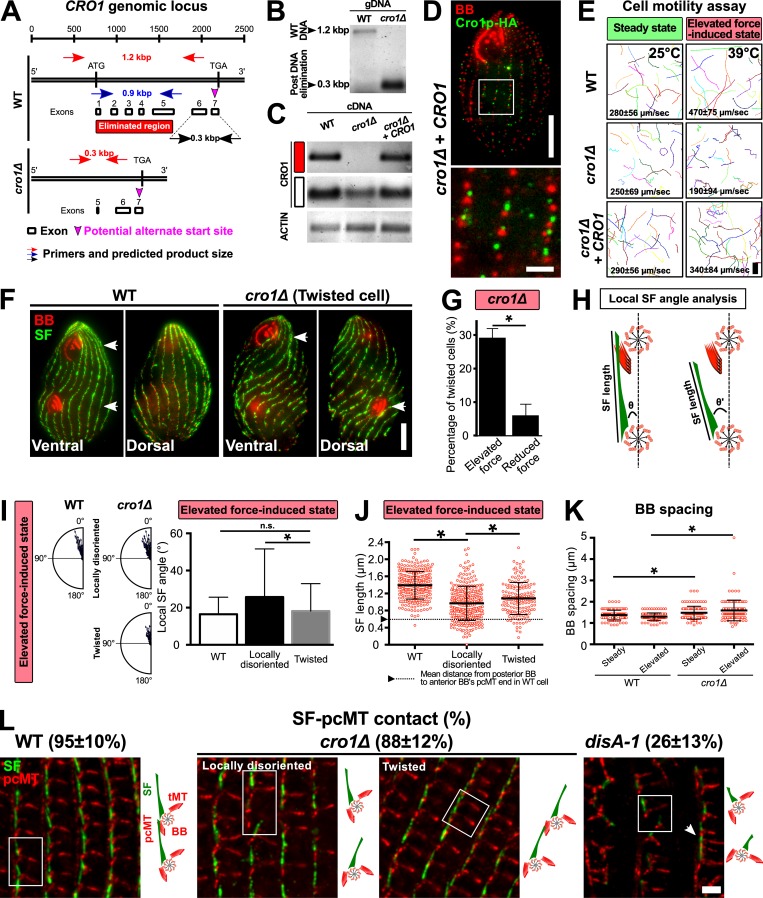
Figure S3.
Cro1p promotes elevated ciliary force-induced SF elongation. (A) Schematic illustrating the genomic locus of CRO1 and the site that was targeted for DNA elimination (red box). (B) PCR assessment confirmed DNA elimination at the targeted site of CRO1 genomic locus. (C) RT-PCR assessment confirmed the absence of CRO1 transcript expression in cro1Δ cells (red box). A partial CRO1 transcript was expressed downstream of the DNA-eliminated region (white box). (D) Expression and localization of Cro1p-HA in cro1Δ rescue strain. BB, red; Cro1p-HA, green. Scale bars, 10 µm (cell), 2 µm (inset). (E) Motility assay of WT, cro1Δ, and cro1Δ rescue cells at steady-state and elevated force-induced state. Scale bar, 100 µm. Motility assay, 90 cells. (F) Mispositioned oral structure in dividing and twisted cro1Δ cells. White arrowheads mark matured and developing oral structures. Scale bar, 10 µm. (G) Twisted cell phenotype is rescued at reduced ciliary forces. To reduce ciliary forces, cro1Δ cells were enriched for the twisted cell phenotype at 39°C for 24 h before they were temperature shifted to 25°C. Percentage of twisted cells was assessed 24 h after temperature shift. (H) Schematic analysis to quantify SF length and local SF angle (θ) relative to the anterior BB. (I) Local SF angle is wider for BBs that exhibit local disorientation as compared to BBs within twisted rows at the elevated force-induced state. (J) Locally disoriented BBs possess shorter SFs than BBs in twisted rows. n ≥ 285 SFs (≥37 cells). (K) BB spacing is marginally increased in cro1Δ cells at steady-state and elevated force-induced state. n ≥ 120 (≥30 cells). (L) Frequency of SF–pcMT contacts in WT, cro1Δ, and disA-1 cells. Schematic illustrates the position and orientation of two BBs within a region of interest (white boxes). White arrowhead marks BB clusters in disA-1 mutants. n = 240 SFs (24 cells). Scale bar, 2 µm. tMT, transverse microtubule. Mann-Whitney test. * denotes P value <0.01. Mean ± SD.

