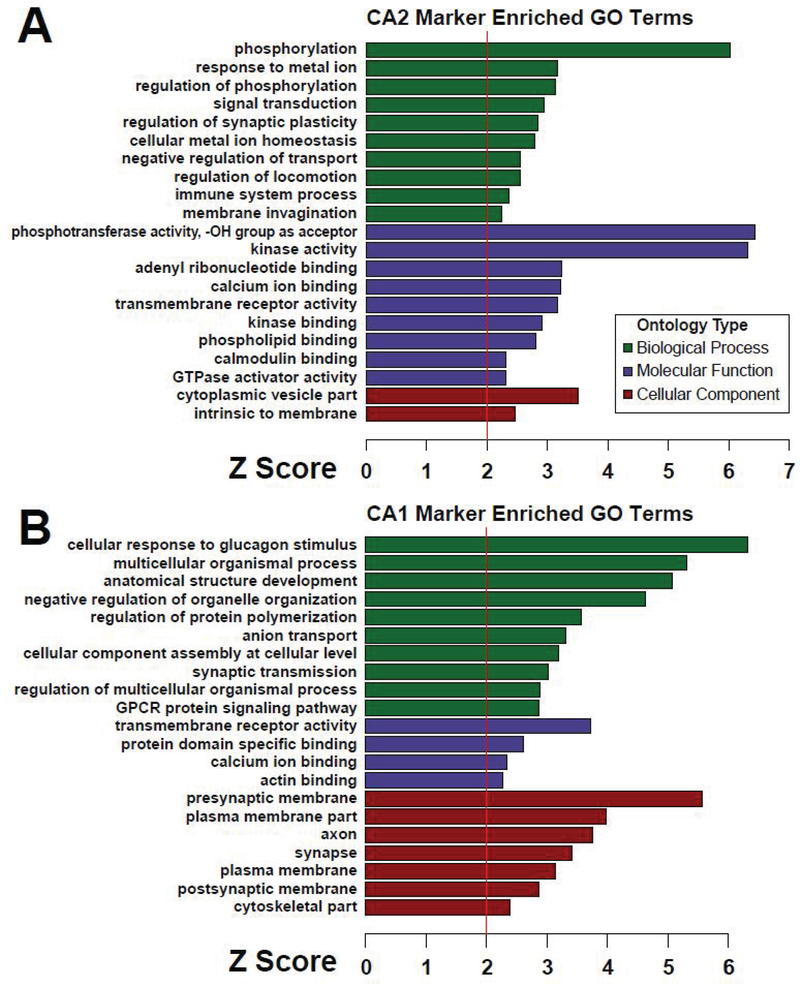
Figure 3. Gene ontology (GO) analysis of CA2- and CA1-enriched proteins.
(A) Gene ontologies enriched in the 100 CA2-enriched gene products relative to 2,947 gene products identified an d quantified in a minimum of two out of three experiments are shown grouped by biological process, molecular function, and cellular component. (B) Gene ontologies likewise enriched in the 85 CA1-enriched gene product proteins are shown grouped by biological process, molecular function, and cellular component. A Z-score of 1.96 represents significant overrepresentation (p < 0.05) relative to the background list of 2,947 gene products.

