
Fig. 1.
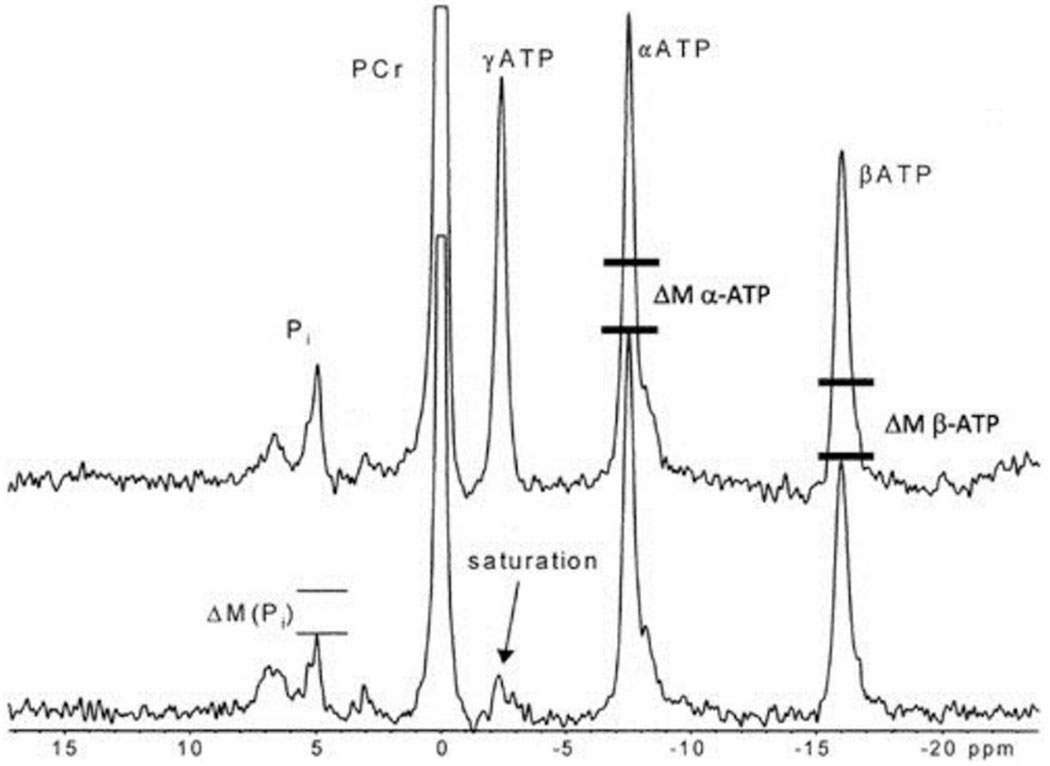
This is adapted from Jucker et al. (23; copyright 2000 National Academy of Sciences, U.S.A.). The top tracing is a 31P NMR spectrum from the human leg under control conditions.
The bottom spectrum is during the saturation of the γ-ATP phosphate where the signal is eliminated, or saturated, by the irradiation, as indicated by the arrow. The saturation of the γ-ATP results in a decrease in the Pi resonance, as shown by the two bars over the Pi peak placed by Jucker et al. This has been ascribed to the ATP hydrolysis rate. However, nearly equal decreases in signal are seen for the α-ATP (ΔM α-ATP) and β-ATP (ΔM β-ATP) resonance, as illustrated by the bars we have added. The reasons for these decreases in signal with the γ-ATP irradiation are discussed within the article. PCr, phosphocreatine; M, magnetization; ppm, parts per million.