
Figure 1.
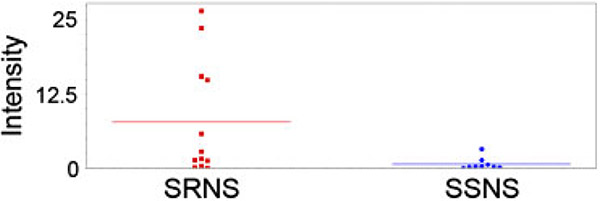
Scatterplot of peak intensity of the 13.8 kDa peak in SRNS vs. SSNS. The horizontal lines represent the mean value and each dot represents the intensity of the peak in one patient sample. The mean intensity is 11-fold higher (p<0.039) in SRNS patients than in SSNS patients with an AUC of 0.73.