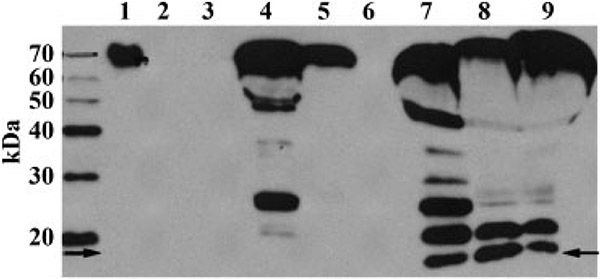
Figure 2.

Western blot of A1BG. Lane 1 is 50 ng recombinant full-length human A1BG. This lane was moved in the image from the left side of the MW markers to its current location, but was otherwise not manipulated. Lanes 2 and 3 are healthy controls that demonstrate a lack of protein relative to the disease samples. Lanes 4–6 are from SSNS patients and lanes 7–9 are from SRNS patients. Note the appearance of the lower band (arrows) at approximately 14 kDa. This band is present in the SRNS samples, which display a greater degree of fragmentation, but is absent in the SSNS samples.
