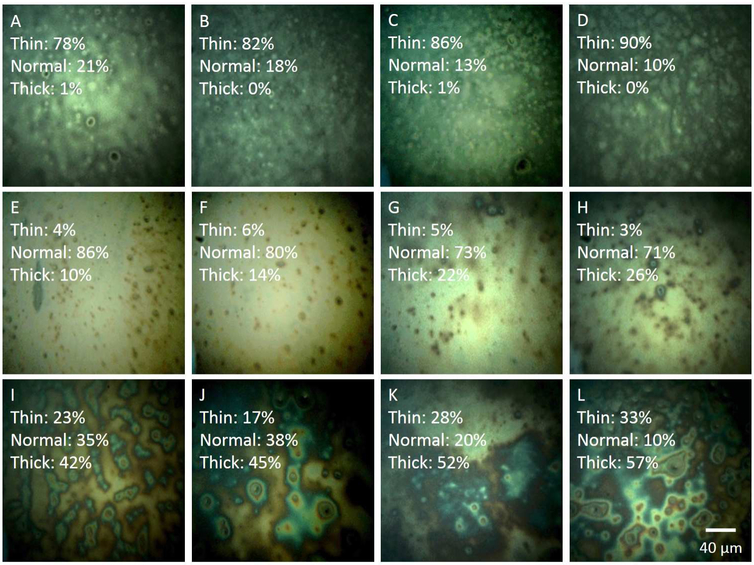
Figure 4.
A-L: Lipid layer images quantified using the algorithm. At the upper left corner of each image, the percentages of pixels falling into the thin, normal, and thick ranges are displayed. A-D, images of thin lipid layers. E-H, images of lipid layers with normal thickness. I-L, images of thick lipid layers.

