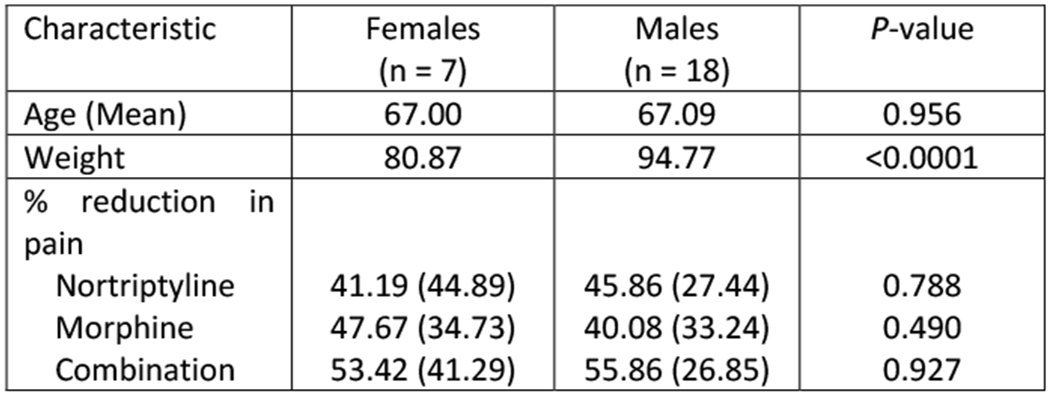
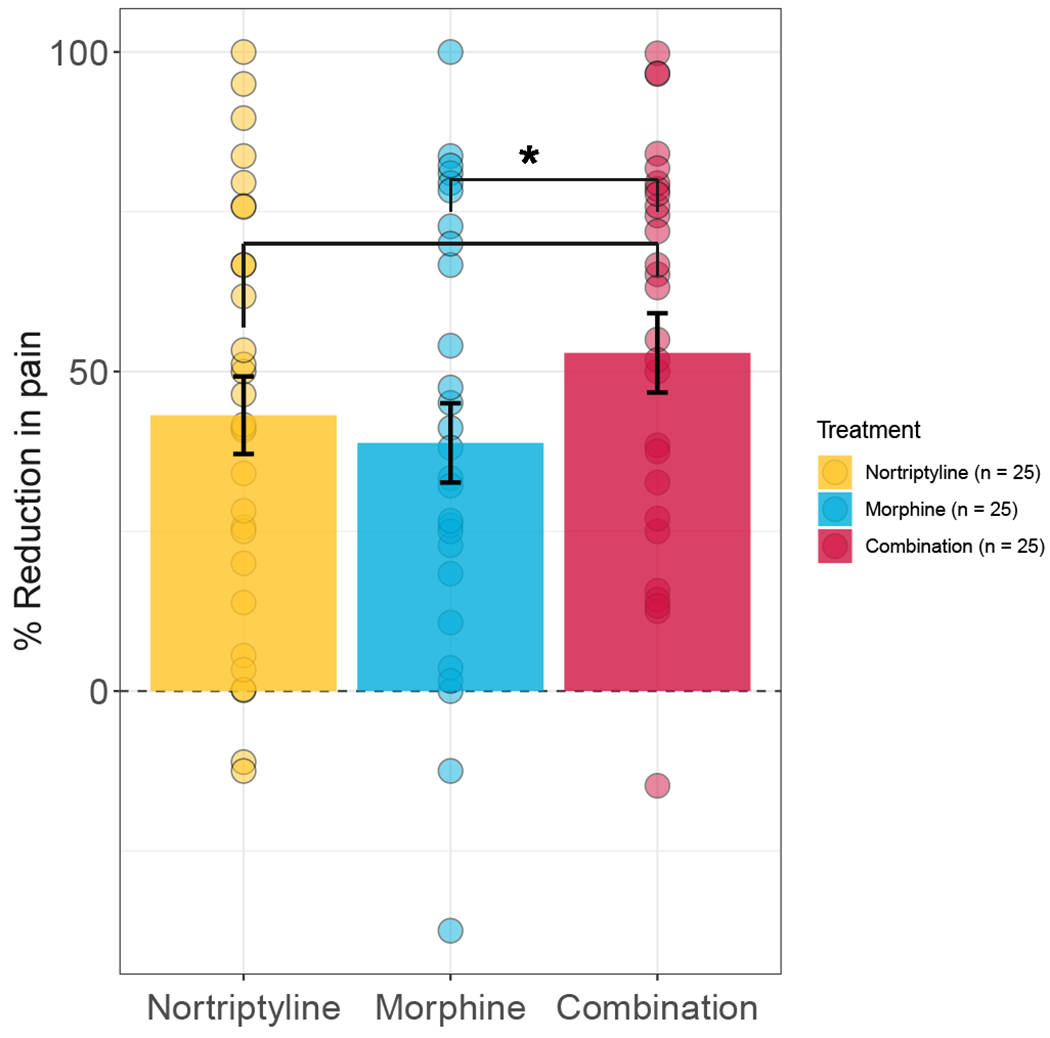
Figure 1. Pain score characteristics in the discovery cohort.


(A) Participant demographics and percent change in pain scores characteristics by sex. None of the observed differences were statistically significant. (B) Percent change in pain score under mono- (i.e., nortriptyline or morphine) or combination therapies. Dots represent individual observations, bars represent means, and error bars represent standard deviations.
