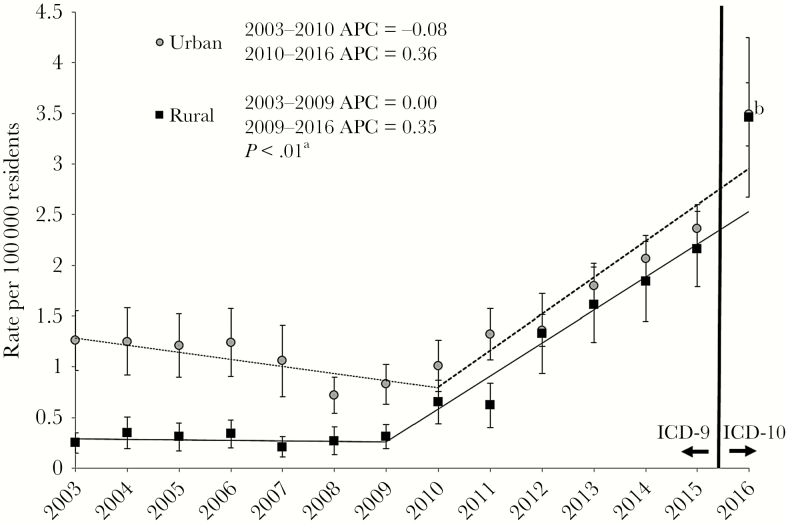
Figure 1.
Rates of hospitalization for injection drug use–associated infective endocarditis for patients by rural–urban status of location of residence, 2003–2016. Error bars represent 95% confidence intervals for observed annual rates. Trend lines (rural, solid line; urban, dashed line) represent regression estimates for trend periods, as determined using joinpoint regression. aUrban vs rural (overall), P < .01. bRate estimates for 2016 overlap. Abbreviation: APC, annual percent change; ICD, International Classification of Diseases.

