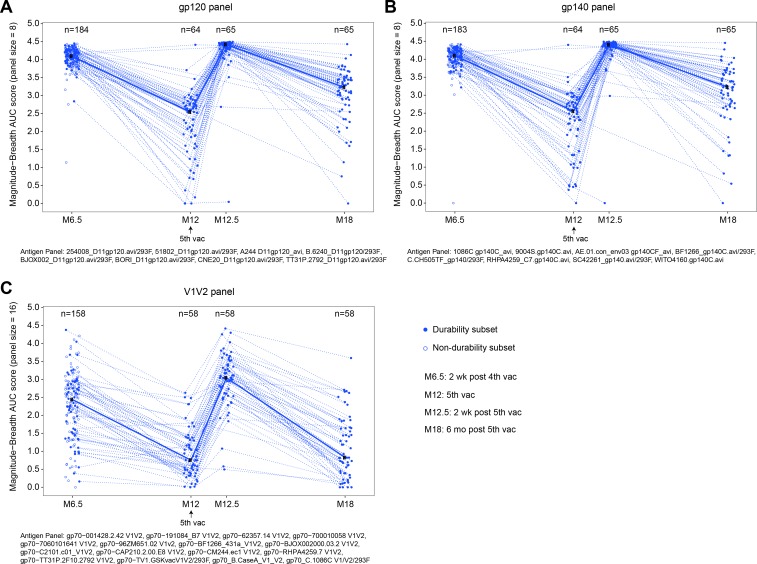
Fig 4. Breadth of IgG binding antibody responses to gp120, gp140, and V1V2 antigens among per-protocol vaccine recipients of HVTN 100.
Responses to gp120 (A), gp140 (B), and V1V2 (C) antigens. Each point represents the area under the magnitude–breadth curve for an individual vaccine recipient, calculated as the average of the log10 (MFI-blank) over the panel of antigens, where antigens are listed in the footnote below each plot. Dashed lines connect the area under the magnitude–breadth curve of each per-protocol vaccine recipient over time. AUC, area under the curve; M[number], month [number]; vac, vaccination.

