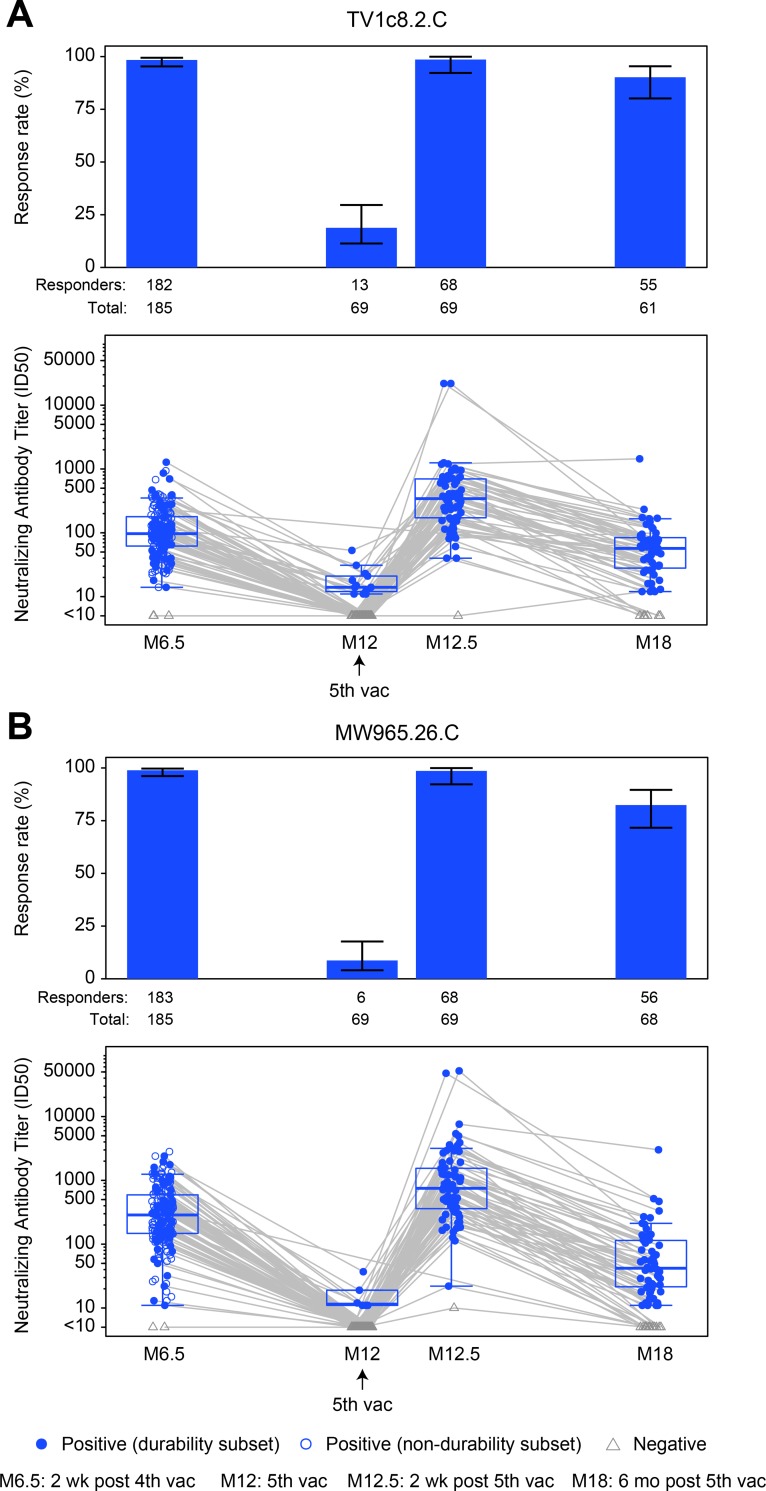
Fig 8. Summary of response rates and magnitudes to vaccine-matched TV1c8.2.C and tier 1A MW965.26.C among per-protocol vaccine recipients of HVTN 100.
Responses to (A) TV1c8.2.C and (B) MW965.26.C. Bar charts show response rates with 2-sided 95% CIs. Boxplots show response magnitude as the ID50 neutralizing antibody titer and are based on positive responders, shown as solid blue circles; negative responders are shown as grey triangles. Grey lines connect the response magnitude of each per-protocol vaccine recipient over time. M[number], month [number]; vac, vaccination.

