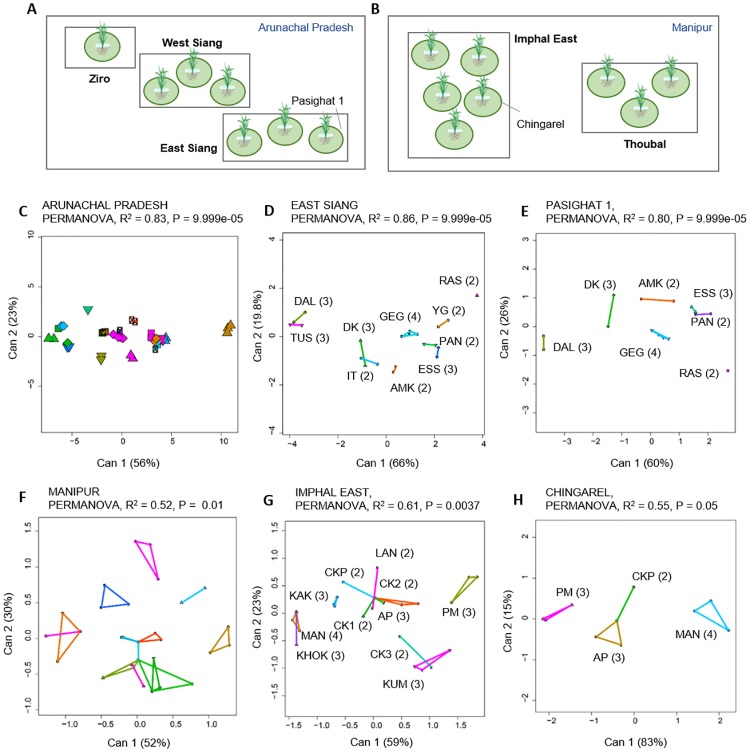
Fig 4. Phenotypic variability of Methylobacterium across spatial scales.
(A–B) Schematic showing different regions (highlighted in bold) and field sites sampled in (A) Arunachal Pradesh, and (B) Manipur. Each circle represents a sampled rice field. The schematic is not to scale. (C–H) Canonical variance analysis biplots of carbon use profiles, showing the clustering of Methylobacterium isolates by landraces sampled (C) within Arunachal Pradesh, (D) within the East Siang region in Arunachal Pradesh, (E) within a single field (Pasighat 1) in Arunachal Pradesh; (F) within Manipur, (G) within the Imphal East region of Manipur, and (H) within a single field (Chingarel) in Manipur. Each point represents an isolate, and numbers in parentheses indicate the number of distinct isolates from each landrace (landrace names are abbreviated as indicated in S2 Table). In panels C and F, we omitted landrace names for clarity. In panels C–G, axis labels indicate the proportion of variation explained, and convex hulls represent 95% confidence intervals for each landrace (colors indicate different landraces).

