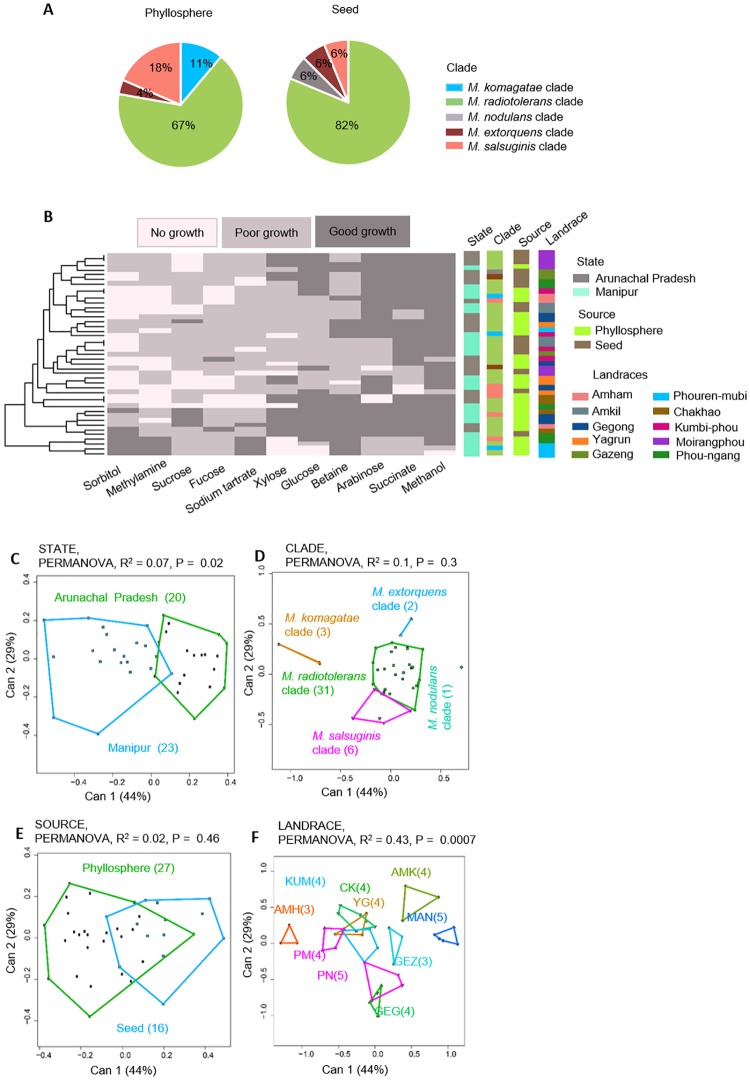
Fig 6. Phenotypic variation in the Methylobacterium isolates from phyllosphere and seed.
(A) Piecharts showing Methylobacterium clade composition from phyllosphere vs. seed surface. (B) A summary of the ability of 43 Methylobacterium isolates (from sources described in panel A) to utilize a panel of 11 carbon sources. Each row represents one isolate; each column represents a carbon source; and cells are colored based on qualitative growth of each isolate in each carbon source. Isolates are clustered (see dendrogram on the left) based on Euclidian distances and Ward clustering, given their carbon use phenotype. Columns to the right represent potential explanatory variables for the carbon use profile of each isolate, and are colored by state, source, Methylobacterium clade, and landrace. (C-F) Canonical variance analysis biplots of carbon use profiles, showing the clustering of all 43 Methylobacterium isolates by (C) state, (D) Methylobacterium clade, (E) source, and (F) landrace. Each point represents an isolate, and numbers in parentheses indicate the number of isolates in each group. Convex hulls represent 95% confidence intervals.

