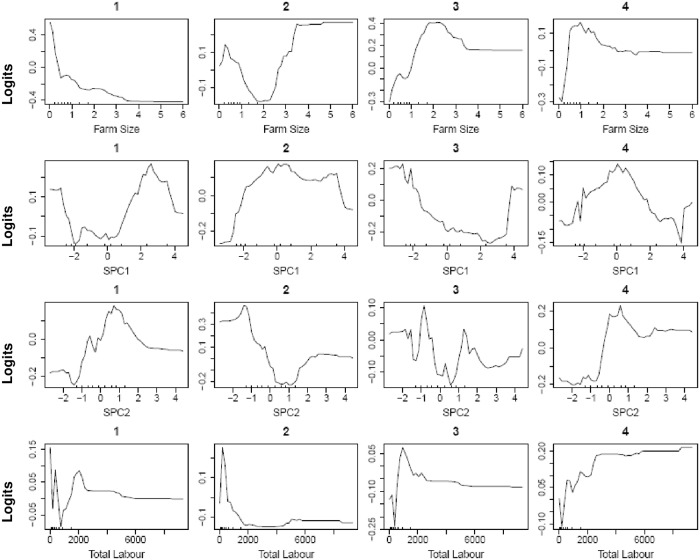
Fig 6. Partial dependence plot on the leading four influential variables (farm size, SPC1, SPC2, and total labor), as identified in classification and regression tree relative variable importance plot (cf. Fig 6).
At the top, 1,2,3,4 (individual class) represents the 1st quartile (Q1), 2nd quartile (Q2), 3rd Quartile (Q3), and 4th quartile (Q4) of total maize yield, respectively.

